Penalties in the English Premier League: Has VAR Helped?
The introduction of the Video Assistant Referee (VAR) into the English Premier League this season has been met with criticism due to the controversies that it led to - things from taking too long, drawing arbitrary lines for offsides, and inconsistent application of VAR and laws. All these controversies seem to distract from the intentions of VAR; the goal of which was to reduce the errors made from decisions, and increase the fairness of the game as a result.
One of the ways in which error has historically been introduced into decisions is through referee bias, which is where a referee might make decisions in favour of teams based on things like home/away, game state (winning/drawing/losing), time of the decision (certain decisions are more likely towards the end of games) or club reputation.
So how has VAR actually fared against its goal? Using the past five years’ data (including the 2019/20 season), I’ve done an analysis to see how VAR has impacted penalty award rates.
Has VAR increased the number of penalties?
One of the common suggestions is that the introduction of VAR would result in more penalties. To check this one, I’ve looked at the penalty award rate over the past 5 seasons in the Premier League.
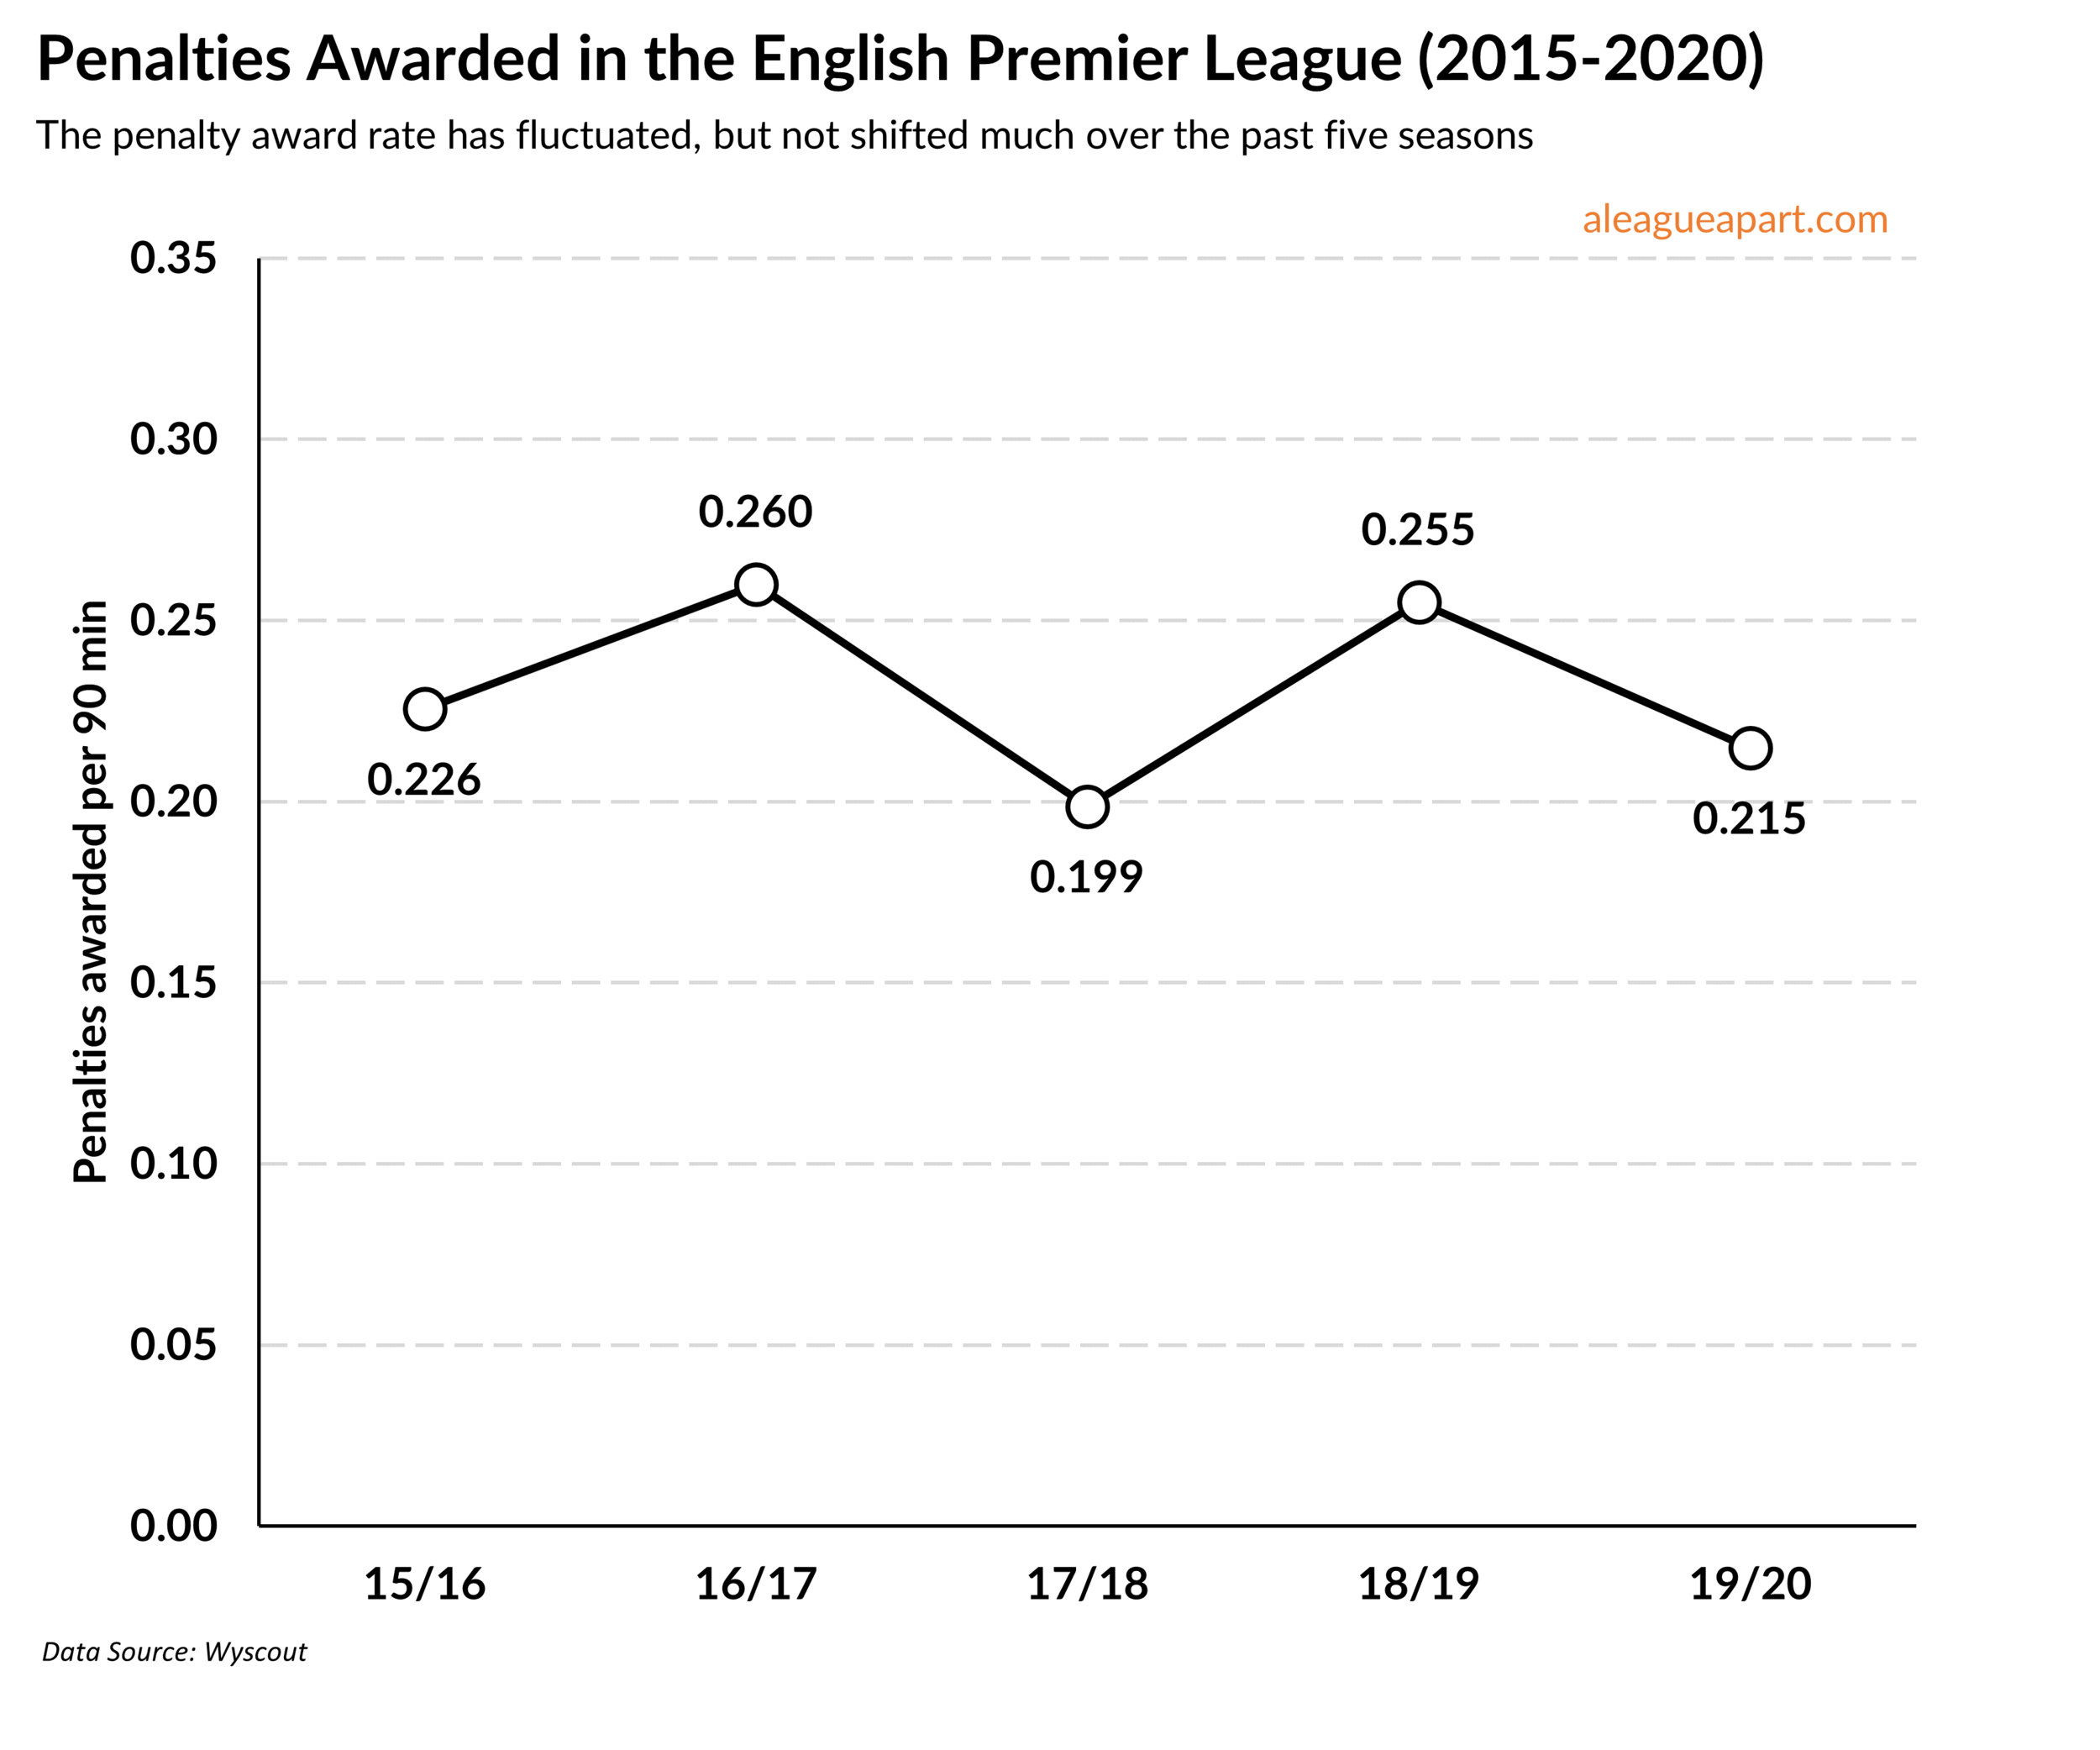
The data suggests that the penalty award rate really hasn’t changed too much this season - it’s down from last season, but in line with previous seasons. The award rate of 0.215 penalties per 90 minutes suggests that there’s likely to be a penalty awarded around once every 4.5 matches.
Penalty Award Bias: Home/Away and Game State
Research suggests that referees are more likely to have a biases, specifically towards home teams and losing teams. As a result, we’d expect the penalty award rates to be higher for those two categories. I used data from the 2015/16 to 2018/19 seasons to calculate the penalty award rate for teams, breaking it down by game state and whether they were home or away. Two notes for this:
The award rates are for each team within a match. So the teams will have a separate (but corresponding, ie. if home team is winning, away team is losing) rate.
There is an uneven split of minutes between each game state - this is controlled for by breaking down the per 90s into their relevant game states.
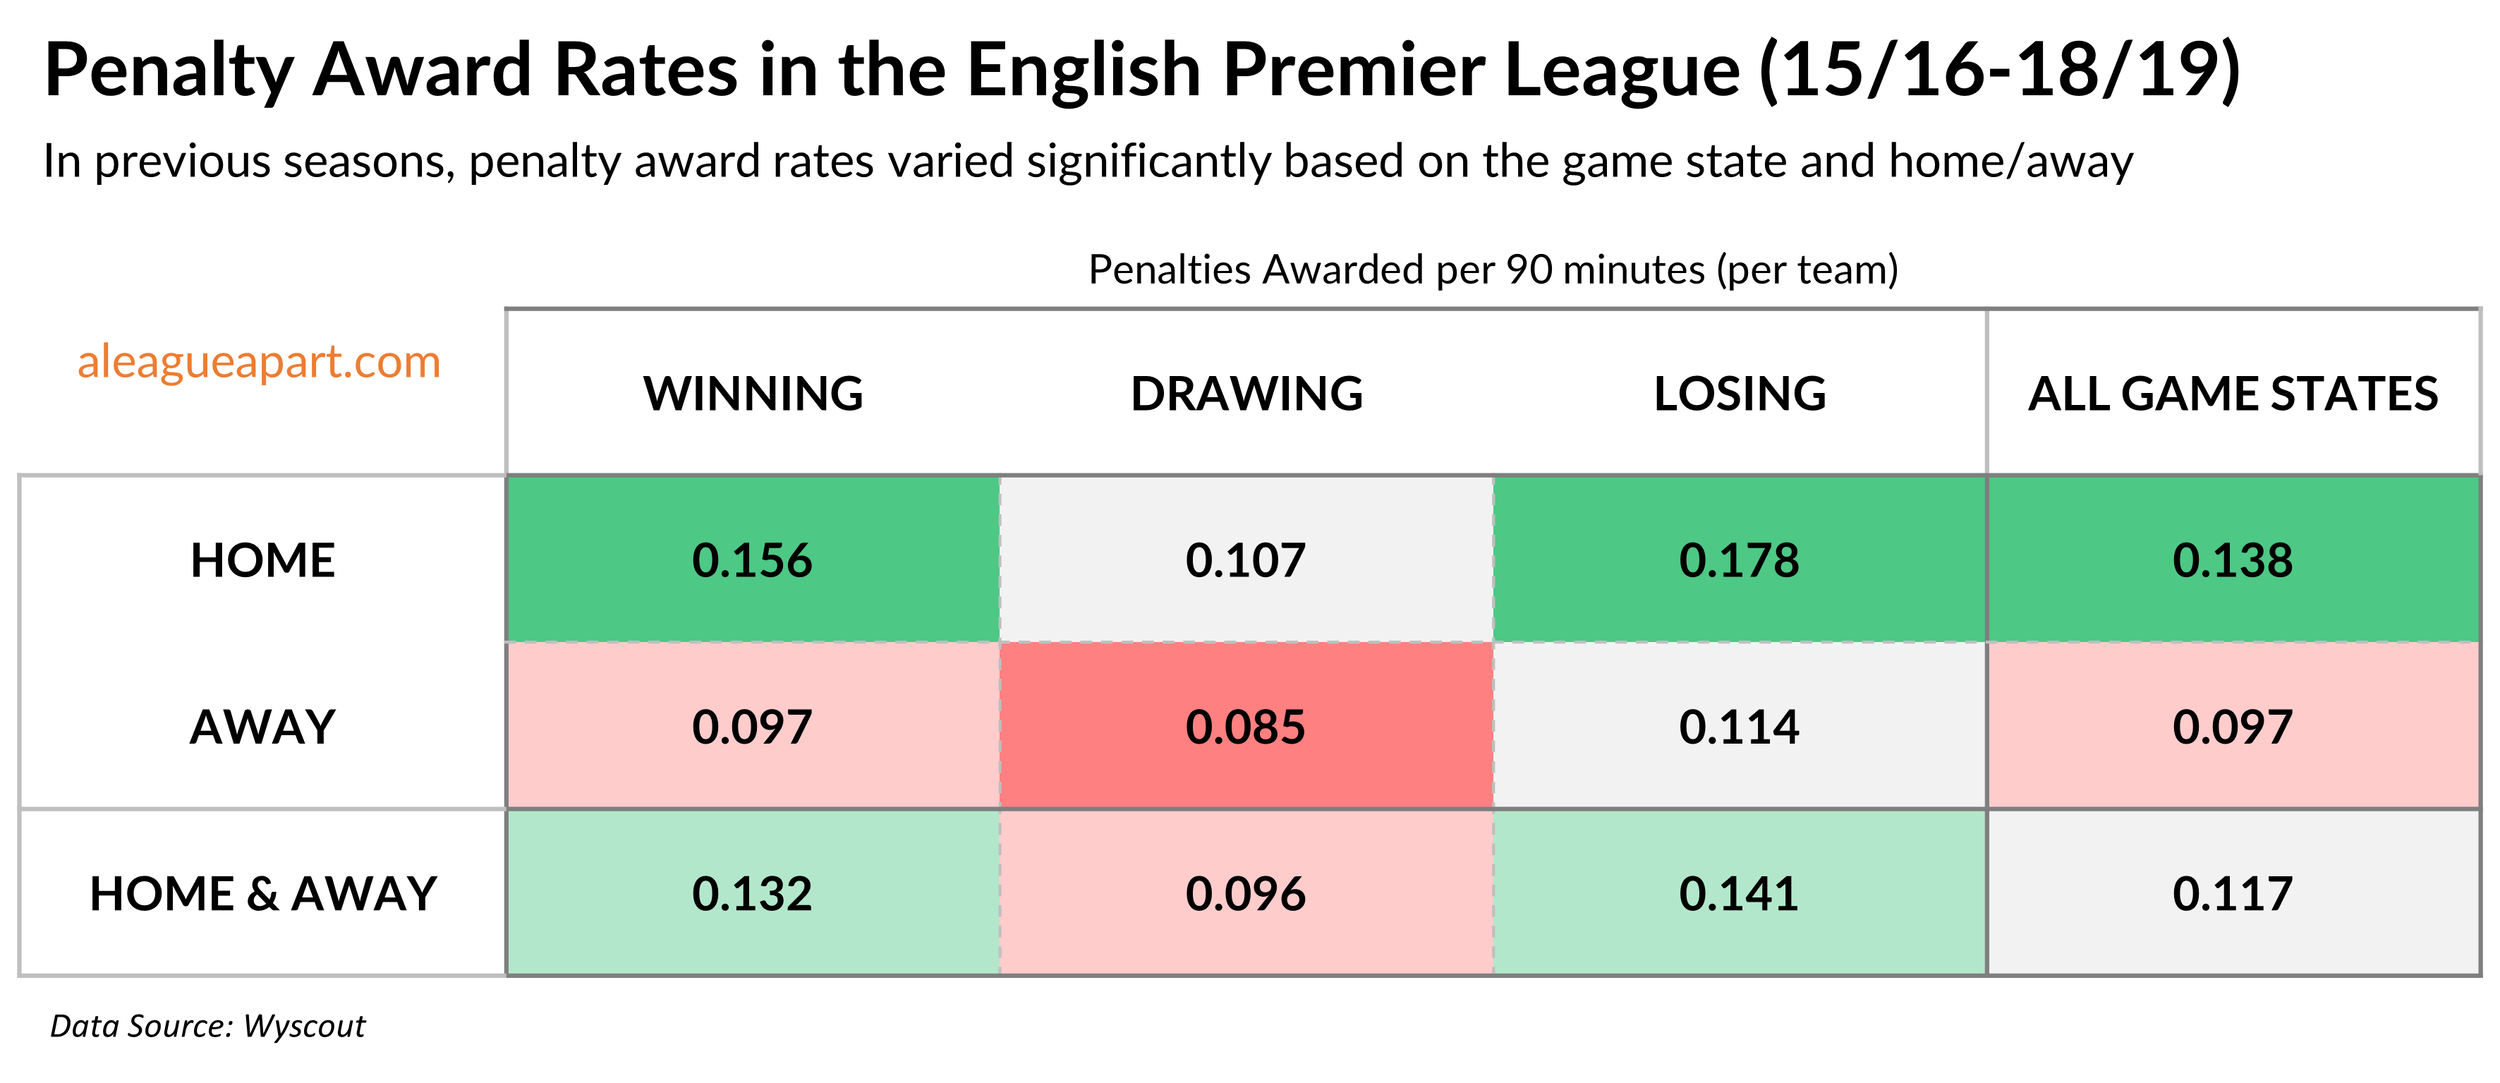
As can be seen from the data, the home team are awarded significantly more penalties than away teams (0.138 home vs 0.097 away), while the game state also affects award rates significantly (0.096 when drawing vs 0.136 when not drawing). The following chart shows the size of the variance:
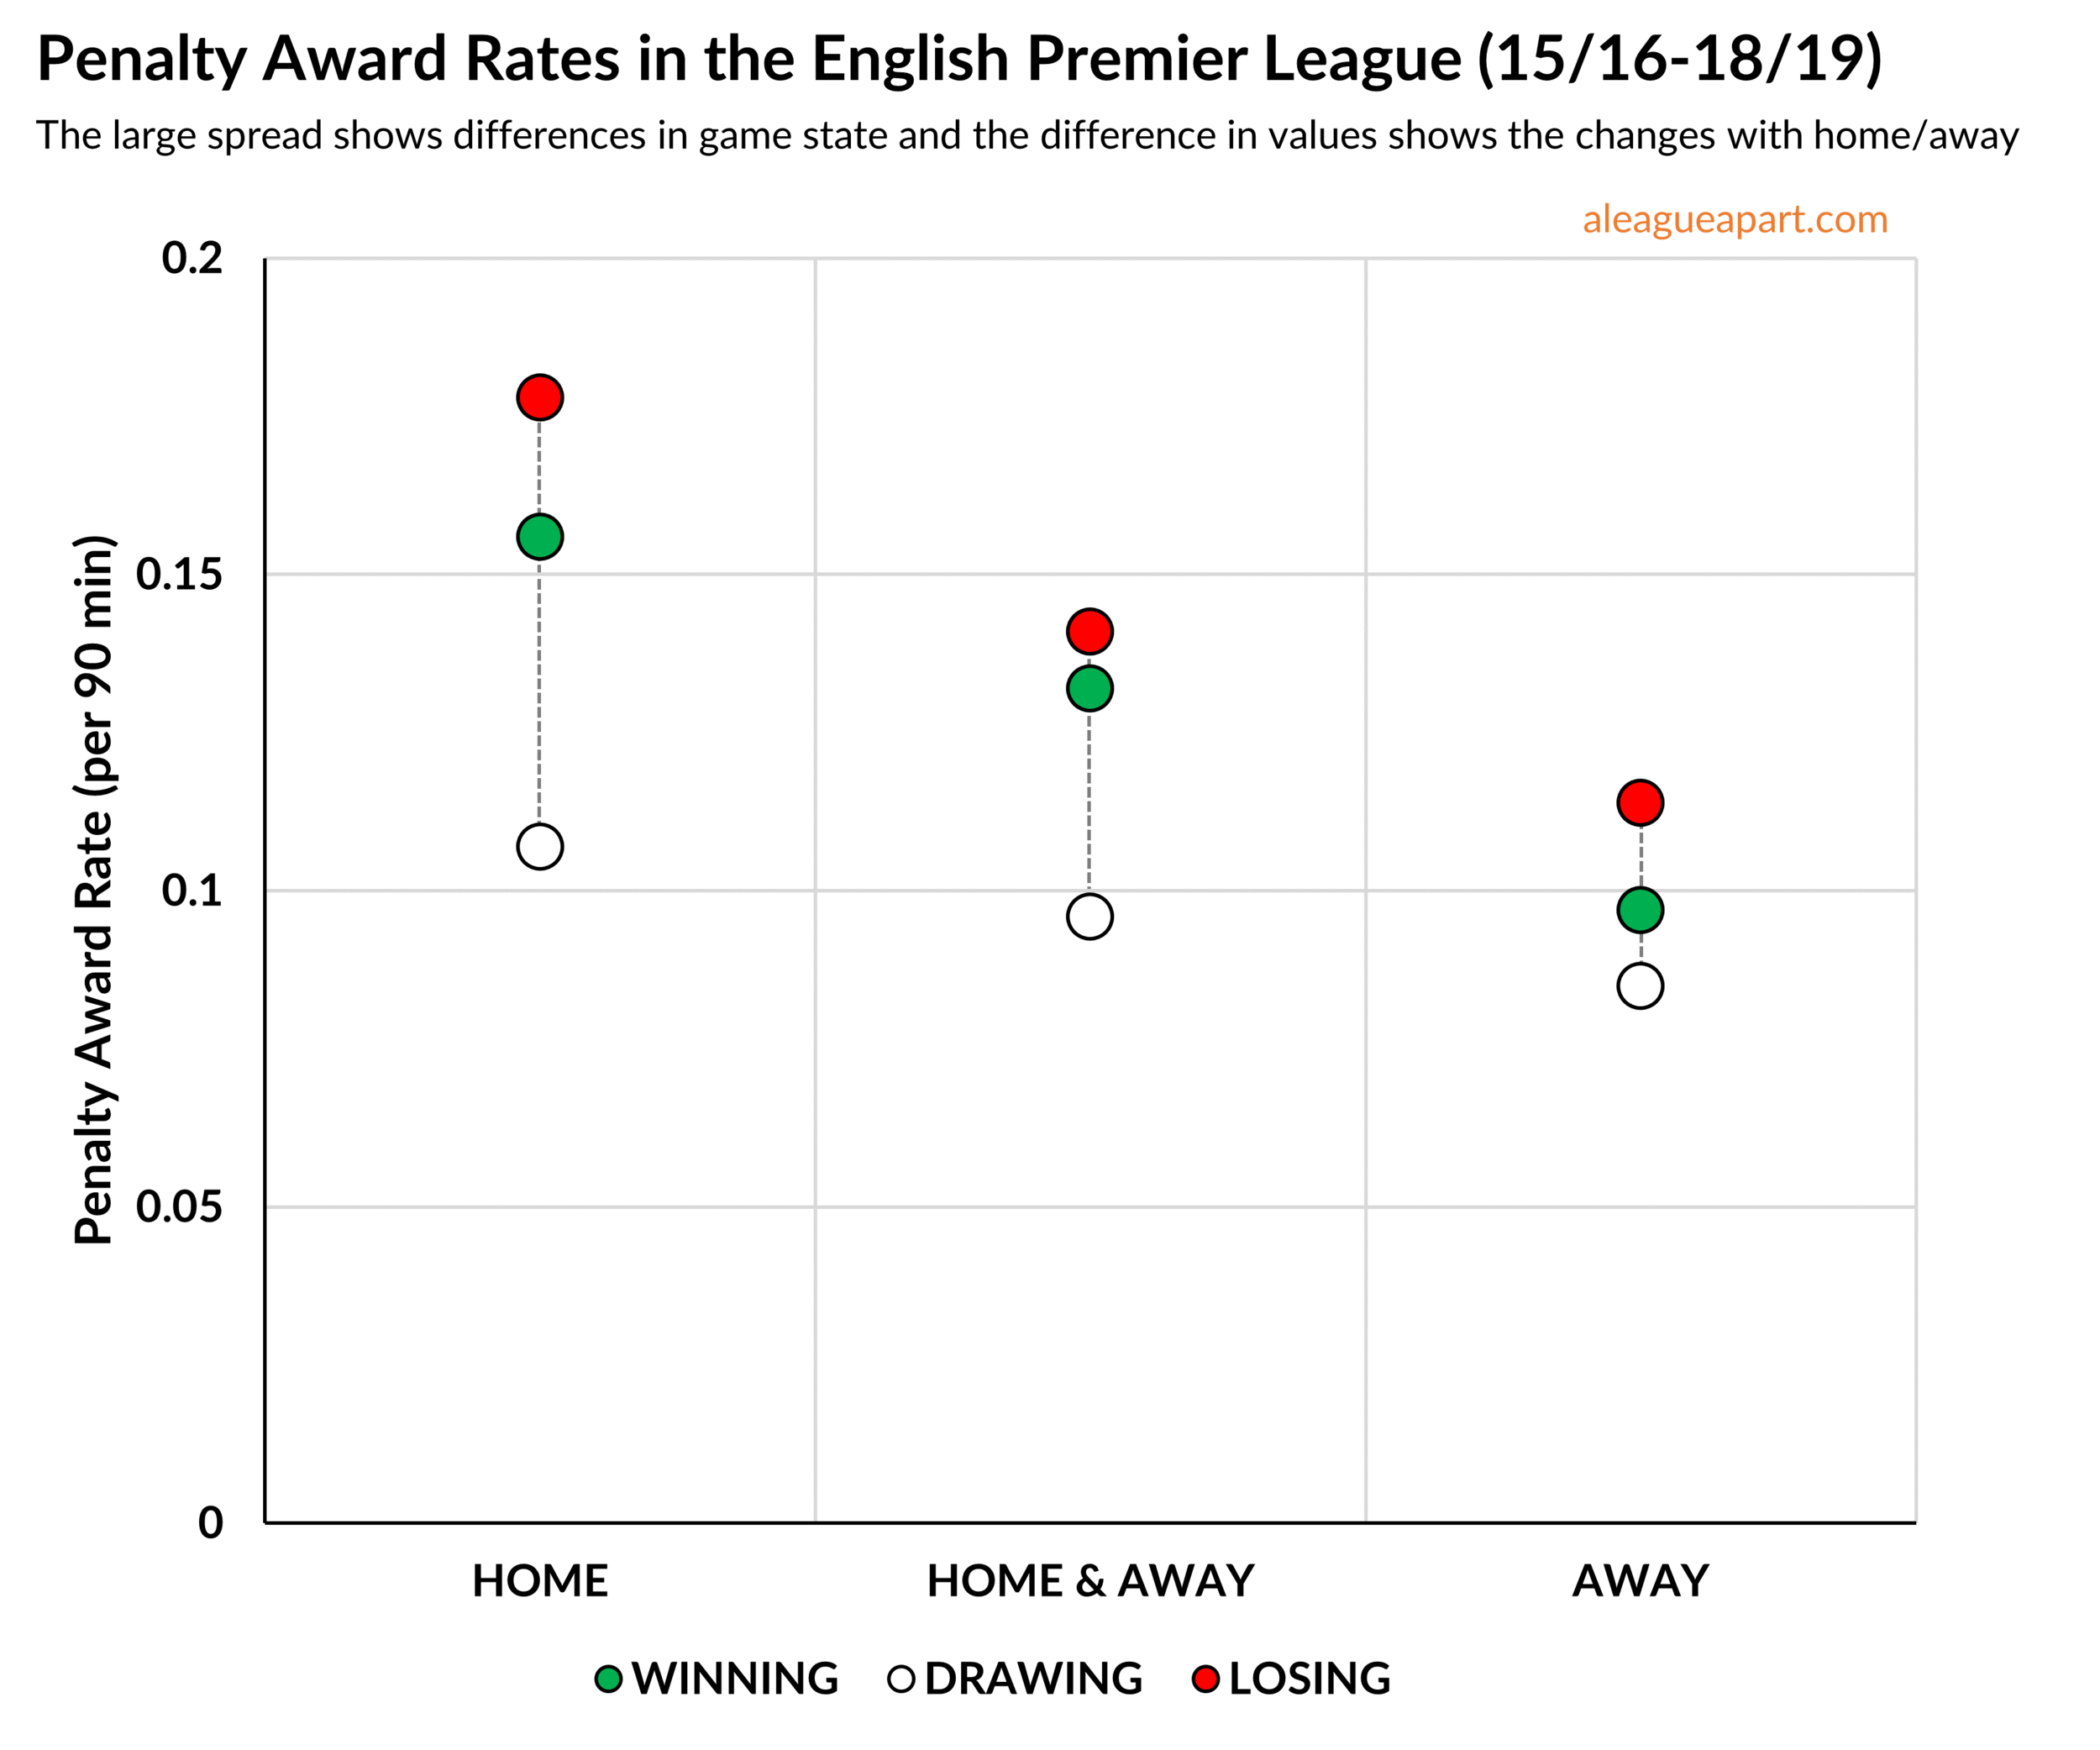
The graph shows that:
Losing teams are more likely to be awarded a penalty (red points are higher than others)
The large variance for home teams suggests a penalty award decision can change significantly based on the home team’s game state (large home dotted line)
The difference in values between home (higher) and away (lower) suggests that penalty award decisions are more weighted towards home teams than away teams.
Overall, it suggests that the game scenario had a fairly large impact on whether a penalty was awarded and that this does not necessarily result in a ‘fair’ decision being made.
It’s important to note that some variance should be expected, due to the following reasons:
Home vs Away: A home team historically wins 45.7% of games (23.9% draw, 30.4% loss), suggesting that home teams are more likely to be attacking, and an attacking side is more likely to spend more time in the opponent’s penalty area.
Draw vs Non-draw: The default game state is a drawn game, so by virtue of more minutes being played in this state, the 'per 90’ amount is lower.
Losing vs Winning: A team that is chasing the game is likely to be more attacking, suggesting they might be more likely to spend more time in the opponent’s penalty area.
Does VAR help to remove the bias?
Theoretically, VAR should help reduce some of the bias that a referee might bring to their decisions. As mentioned above, we’d still expect for there to be some variance, just maybe not as much. I used data from the current season (up to matches played on 4 July) to calculate the same figures.
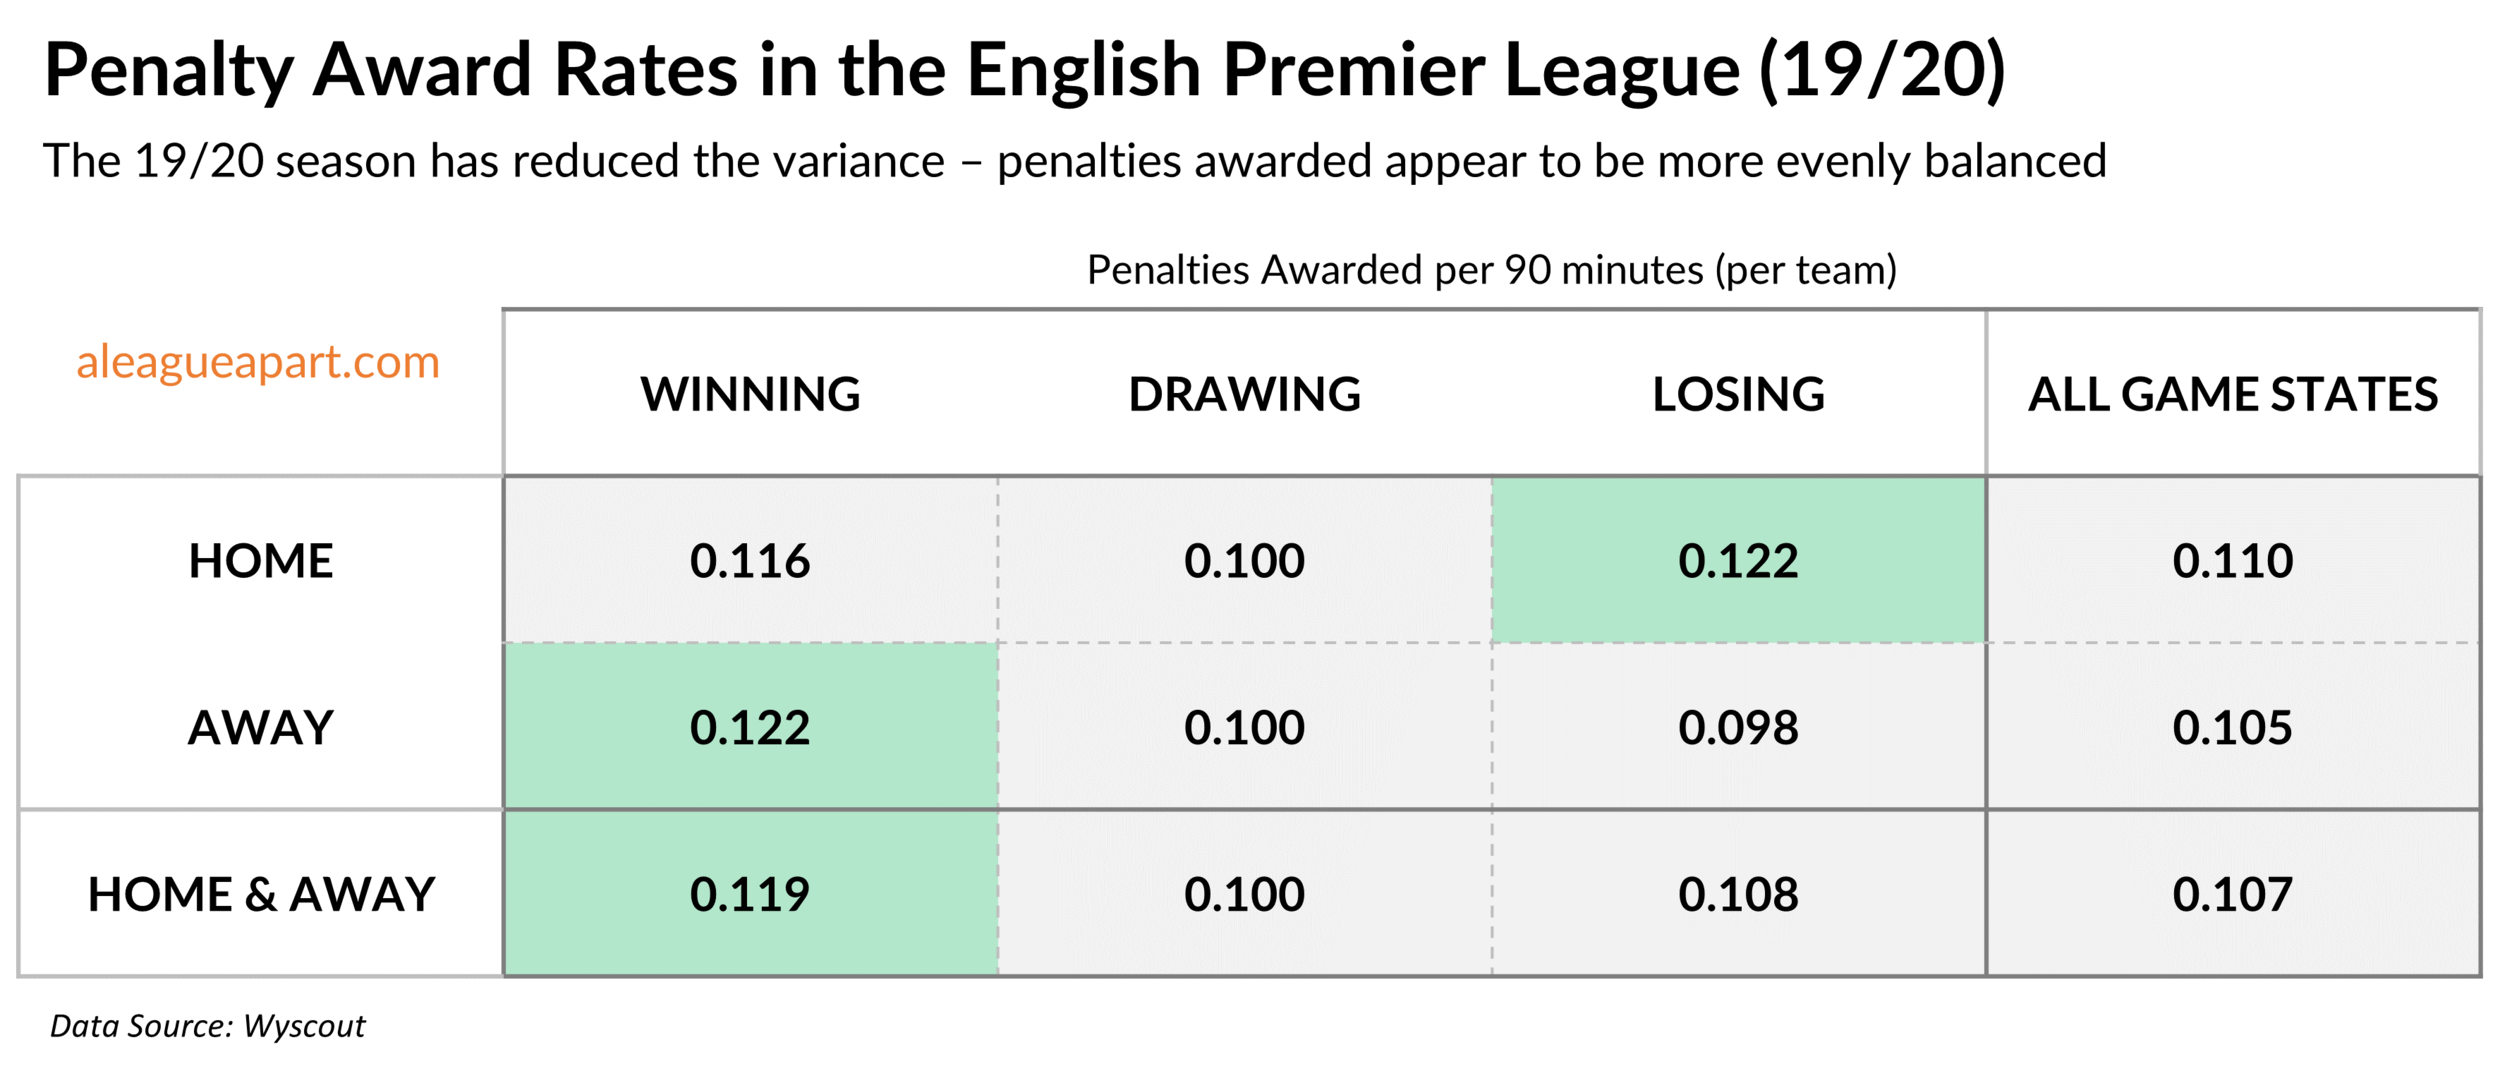
As expected, there is still some variance from the average (0.107), but it’s significantly less - the penalty award rate is significantly more balanced than the previous four seasons. Let’s see how it’s represented in the chart:
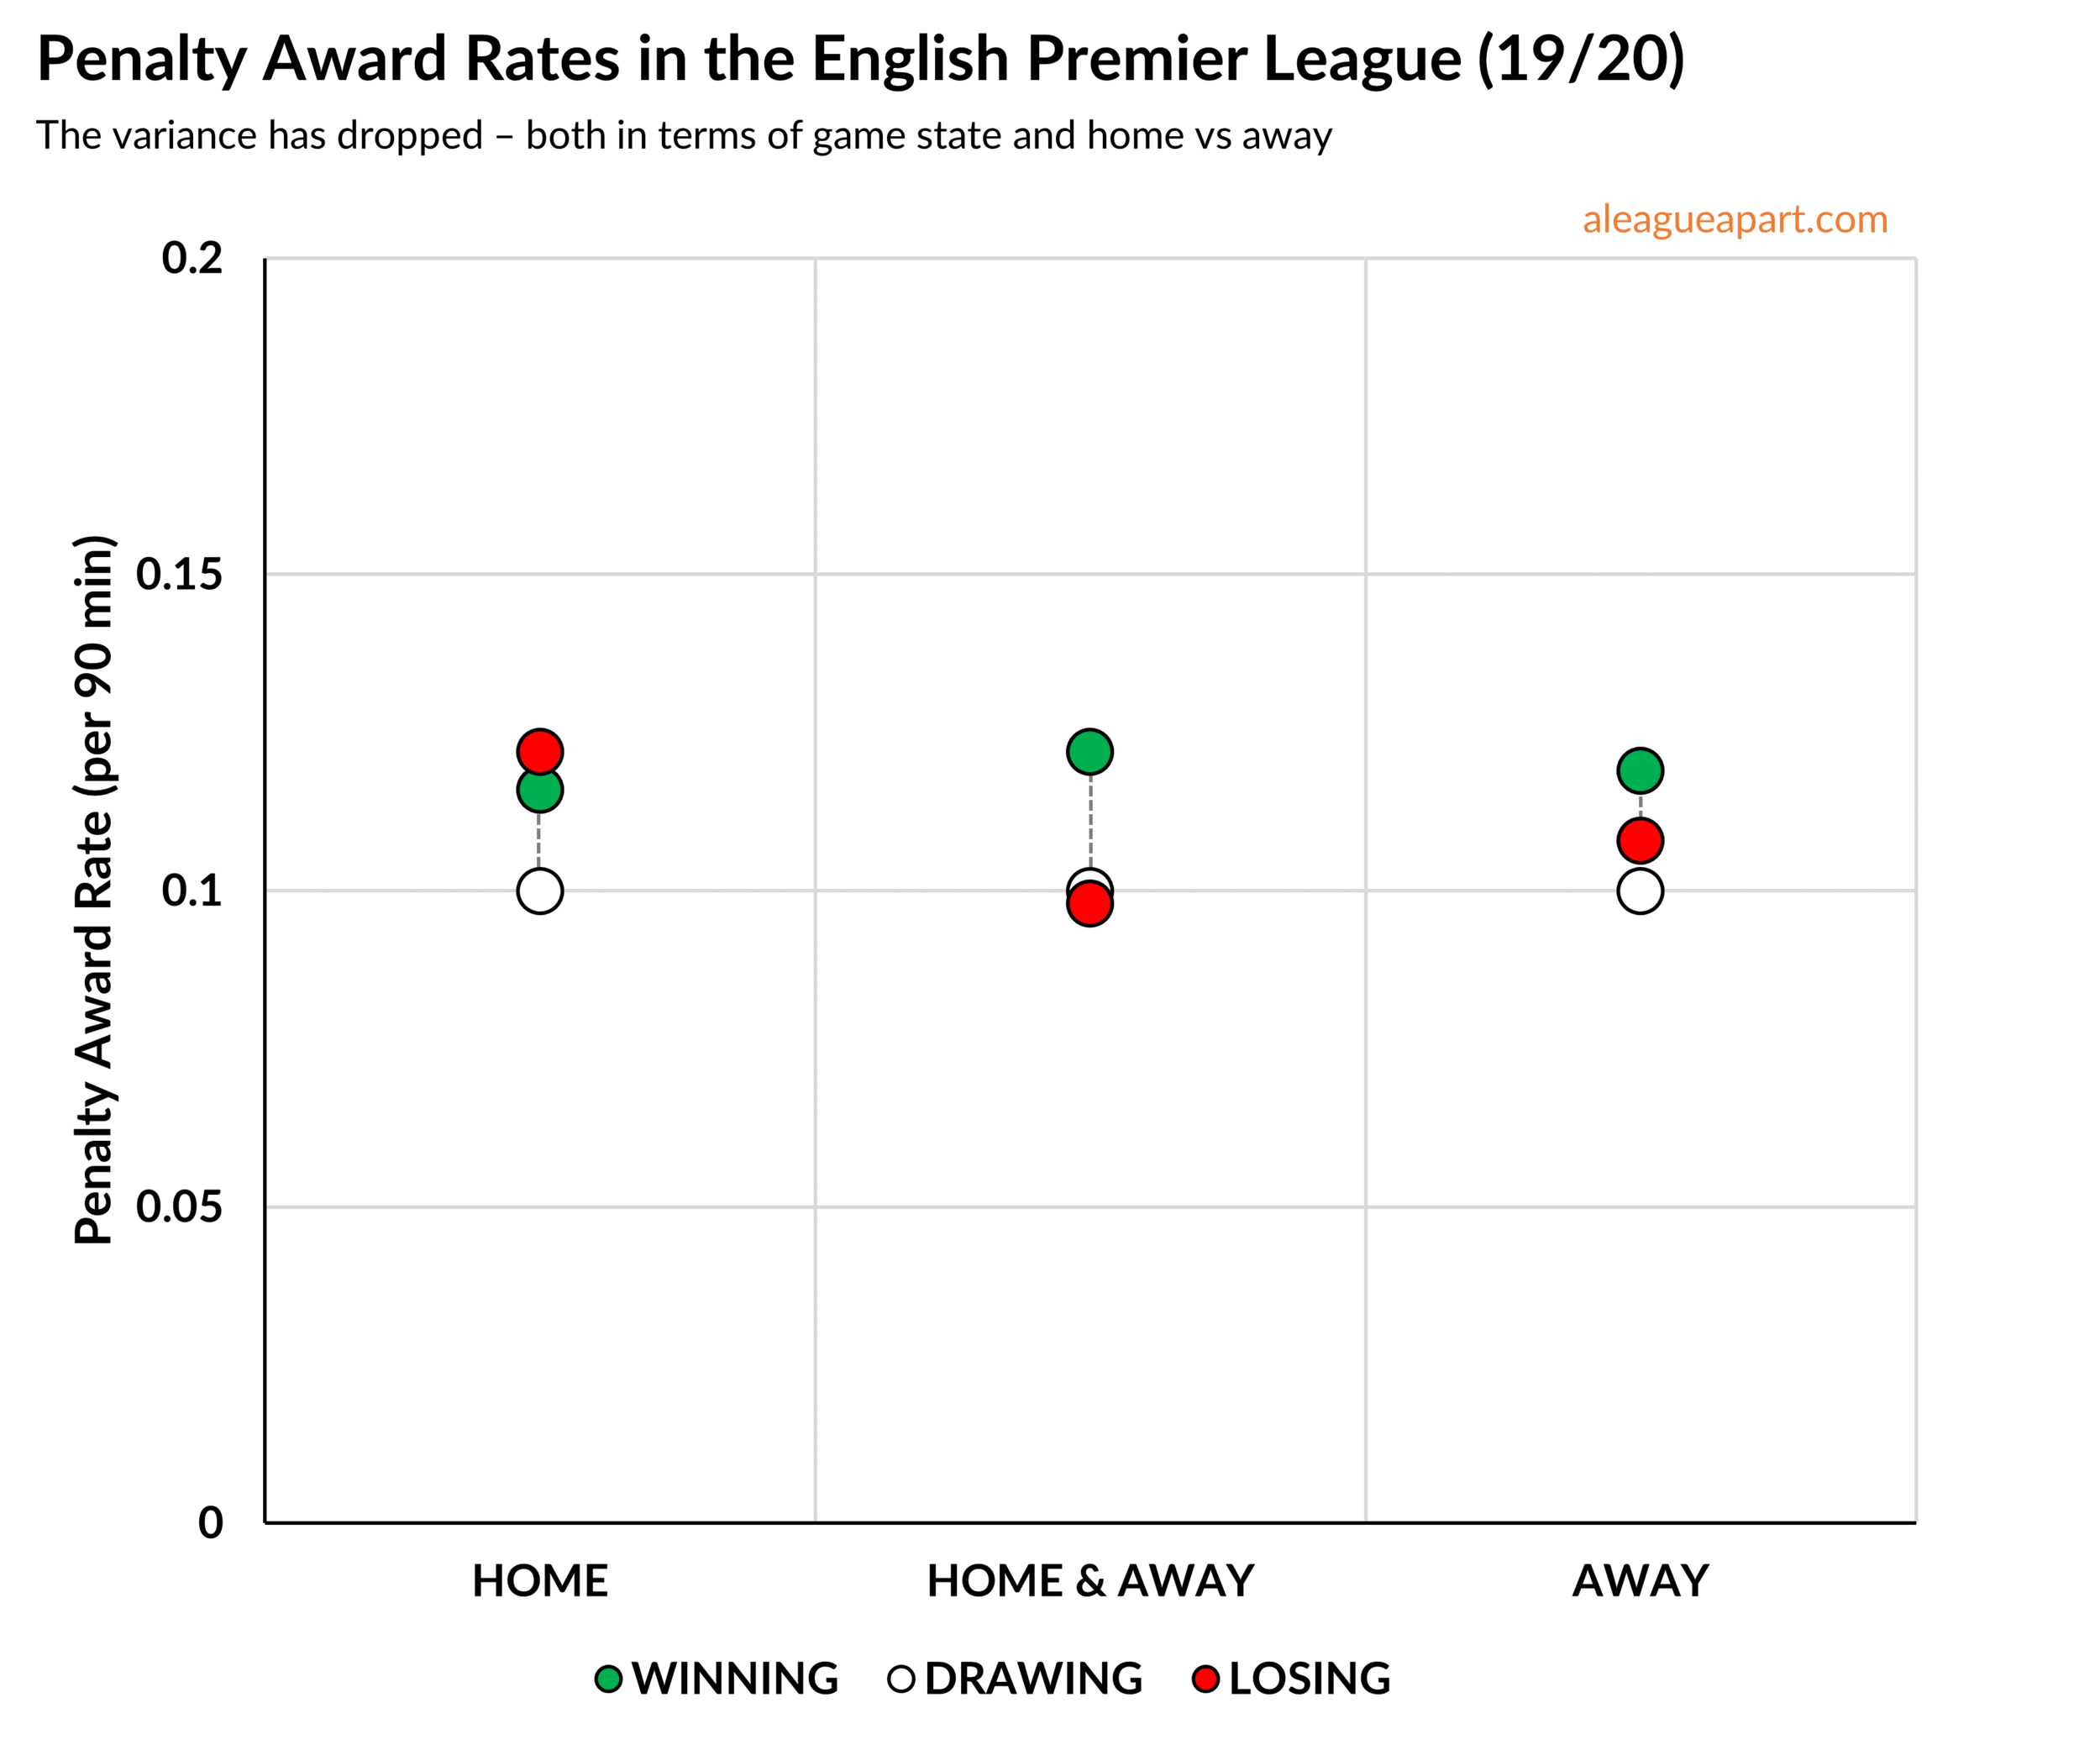
Looks a lot more balanced!
The lower vertical spread suggests that winning/drawing/losing is impacting penalty awards less (dotted lines are shorter)
The home/away bands having similar values suggests that home/away is also impacting penalty awards less (roughly the same values for home/away/home & away)
Summary
So what’s the verdict - has VAR balanced out penalty award decisions to make them less biased by game situations in the EPL?
It actually looks like it might…though with a few notes:
Sample size: VAR has only been in use for this season, so we don’t have a lot of data to work with - the data that I used for the 2019/20 season has got 339 matches (matches up to 9 July 2020). It will be worth revisiting this once the season is over, and for future seasons. Additionally, other leagues have had VAR since previous seasons - Bundesliga and Serie A since 2017/18 and La Liga since 2018/19 - there’s more data that can be used to check on penalty award rates.
The ‘right’ call: This analysis doesn’t look at all at whether a call was ‘right’ or not. There’s still a lot of controversy about whether a handball strikes an arm or a shoulder, or whether a tackle is a foul or not. Unless there’s full consistency in the application of the laws (or someone goes through and watches every penalty back), I can’t control for penalties that should or should not have been awarded.
Reputation bias: Recent research from Norway (as well as every fan’s anecdotal evidence) suggests that ‘bigger’ or more famous clubs can get more favourable decisions. This one’s also a more difficult one to tackle without looking at each individual decision made or using an index to rank size or popularity of clubs, while also probably needing more data than just one league or 20 teams.
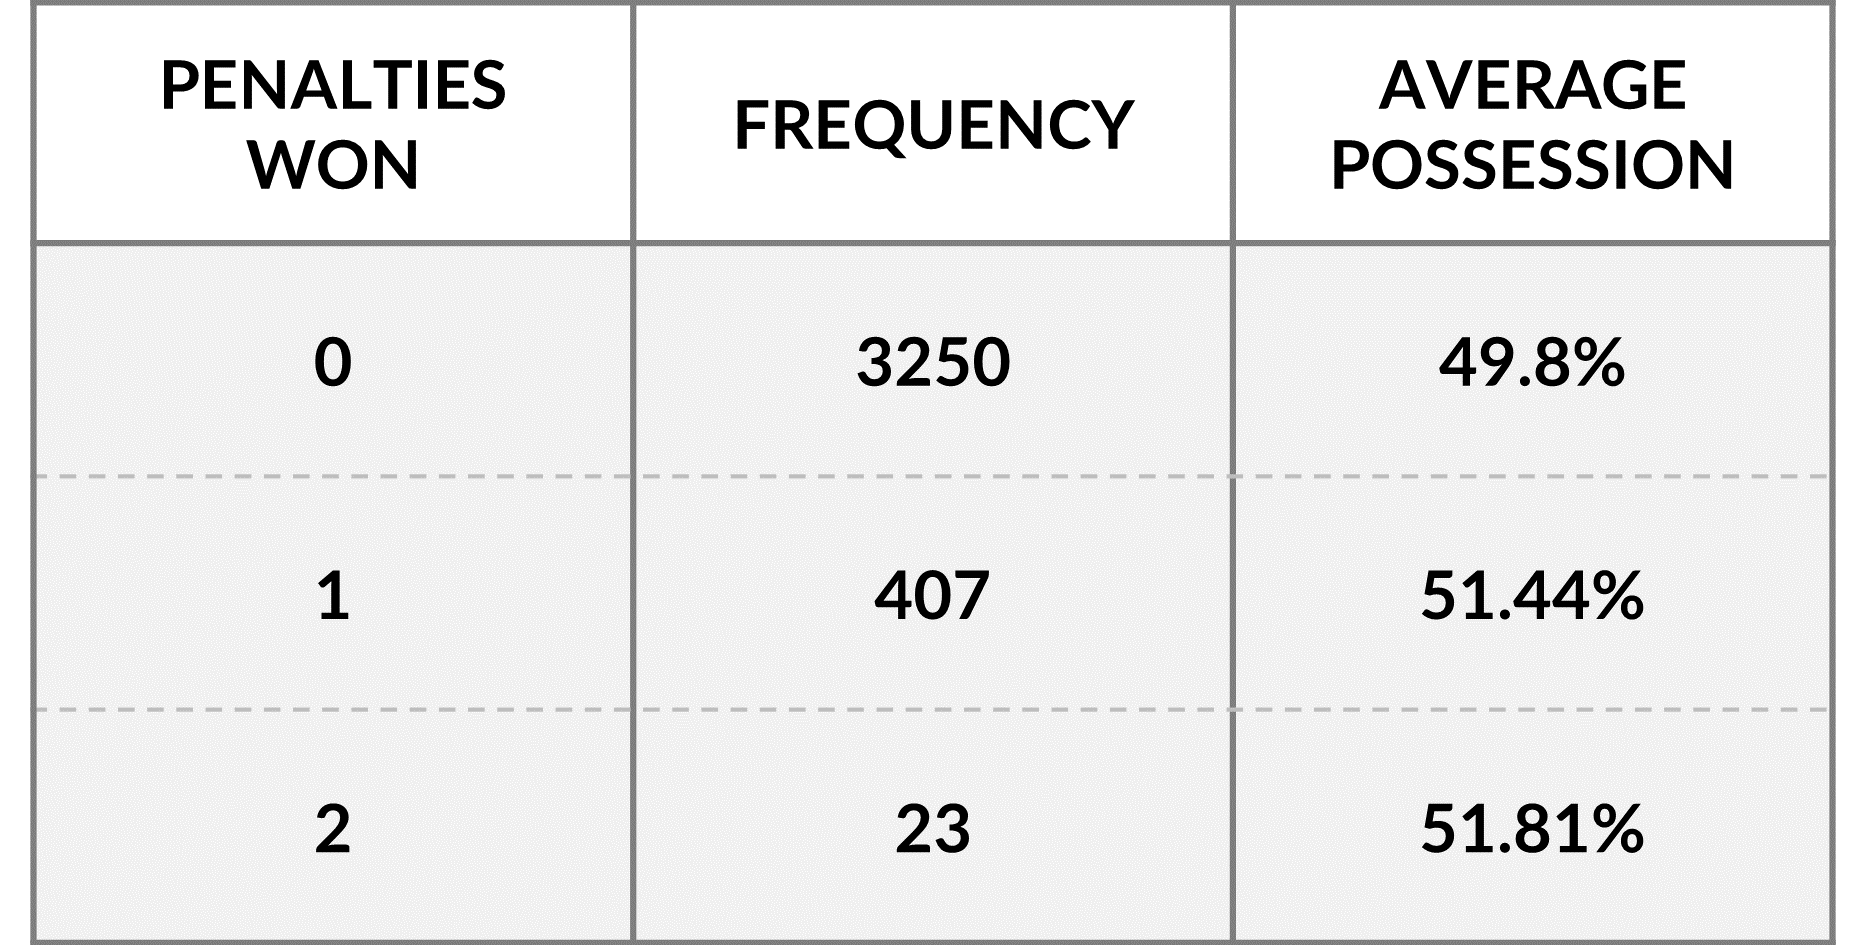
Possession: There’s an additional bit of variance introduced by possession differences in each of the game situations, which affects penalties - a team which has more of the ball is more likely to be awarded a penalty. I’ve done a bit of really basic analysis that suggests that winning a penalty is associated with a higher average possession, but there’s definitely more to be done. I also did some analysis that adjusts the award rates based on minutes of ‘pure possession’ within each game state, but decided to omit it for now. Let me know if you have any thoughts - I might include this in a future article.