Player Ages in the A-League (2021/22 Edition)
The A-League 2021/22 season is drawing to a close, with only the finals series left to be played. With that, we’ve now got a full set of data on the regular season, meaning it’s time to have a closer look at some themes. First up: Player Ages.
How are minutes distributed in the A-League?
One of the discussions that often pops up about the A-League is its age profile. Specifically, in Football Australia terminology, is it a “Production” league (younger player focused), “Peak Performance” league or an “Experienced Player” league (older player focused)?
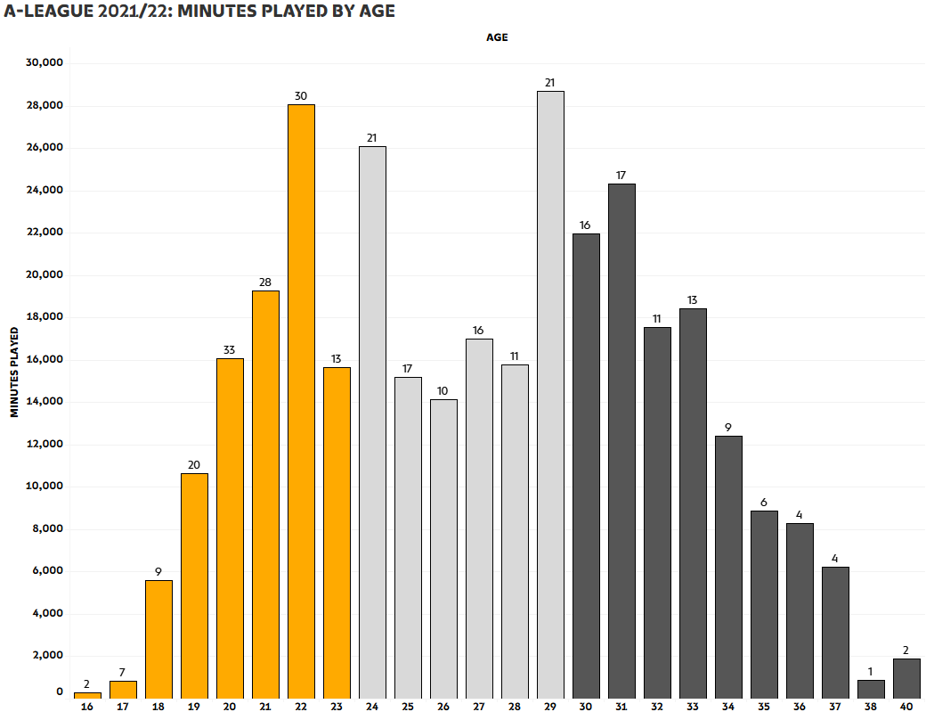
The graph below shows the split of minutes across each age group, with the height of each bar representing the number of minutes played, and the numbers on top of each bar representing the number of players of each age.
Alternatively, here’s the data in table form, with the previous 2 seasons’ data for comparison.
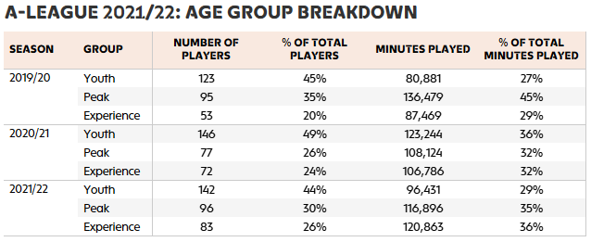
For comparison, the big 5 European leagues’ minutes breakdowns are roughly shaped as Youth: 22%, Peak: 50%, Experience: 28% with variations across leagues. Belgium and Netherlands are ‘younger’ leagues, and their breakdown is Youth: 35%, Peak: 48%, Experience: 17%.
However, it’s quite a sample size, so I’m hesitant to draw too many conclusions from it, while the effects of covid (immigration) are likely to have had an effect on squads last year.
How old is each squad?
The A-League Men’s Twitter account recently shared a graphic that looked at average ages of playing squads in the A-League 2021/22 season.
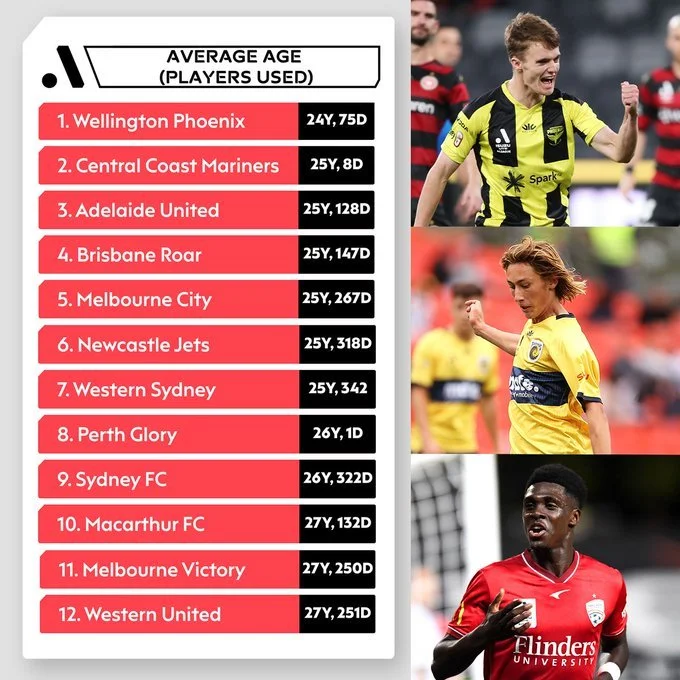
One problem with this graphic is that it looks at an average, with a player needing to record only a single minute to be included in the calculation. As I mentioned in a previous article:
This means it doesn’t take into consideration how much they are playing, or with what regularity – just that if they’ve made an appearance, they are included in the average.
Taking an example from Melbourne City, 16-year old Max Caputo played only 21 minutes this whole season, but because he’s made an appearance, his inclusion brings City’s squad average age down. This season, 38 players had less than 100 minutes of game time, with a median age of 20.5. This group of younger, not-playing-as-much players effectively skew the age profiles of most clubs downwards.
Having taken minutes played into consideration, the average ages are as follows:
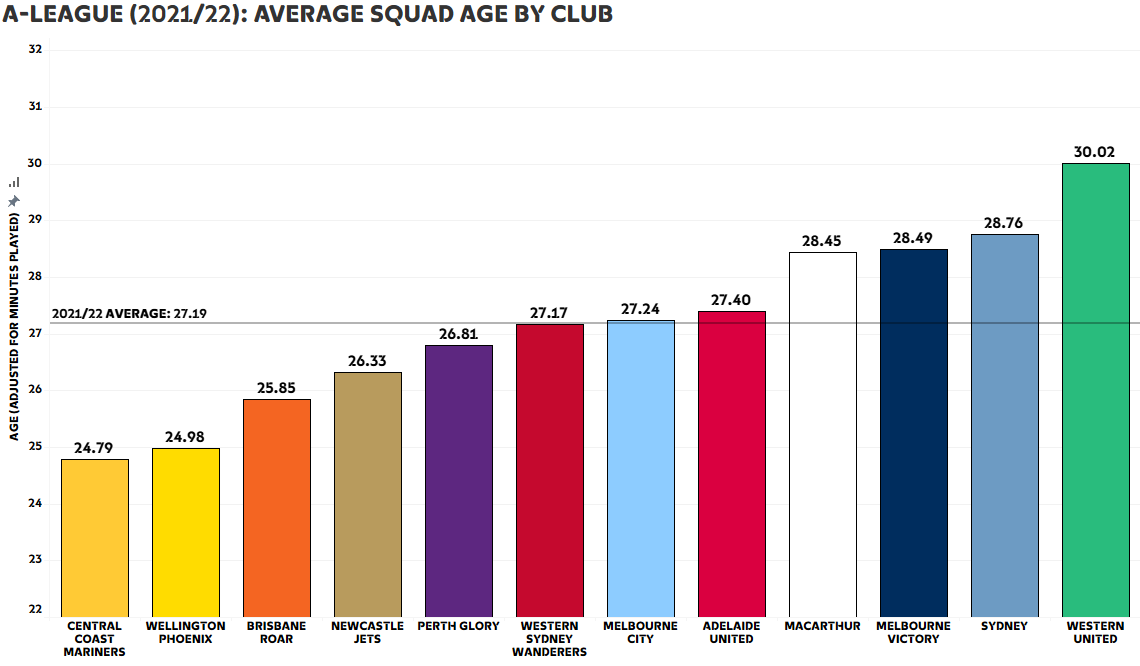
From first glance, the order of squad ages is broadly similar, while the spread of averages has increased; the A-League graphic had a spread of about 3.5 years between squad averages while ours has a spread of about 5 years. It’s about an even split between clubs whose average gets older and clubs whose average gets younger.
For good measure, I also looked at how ages have changed between this season and the last.
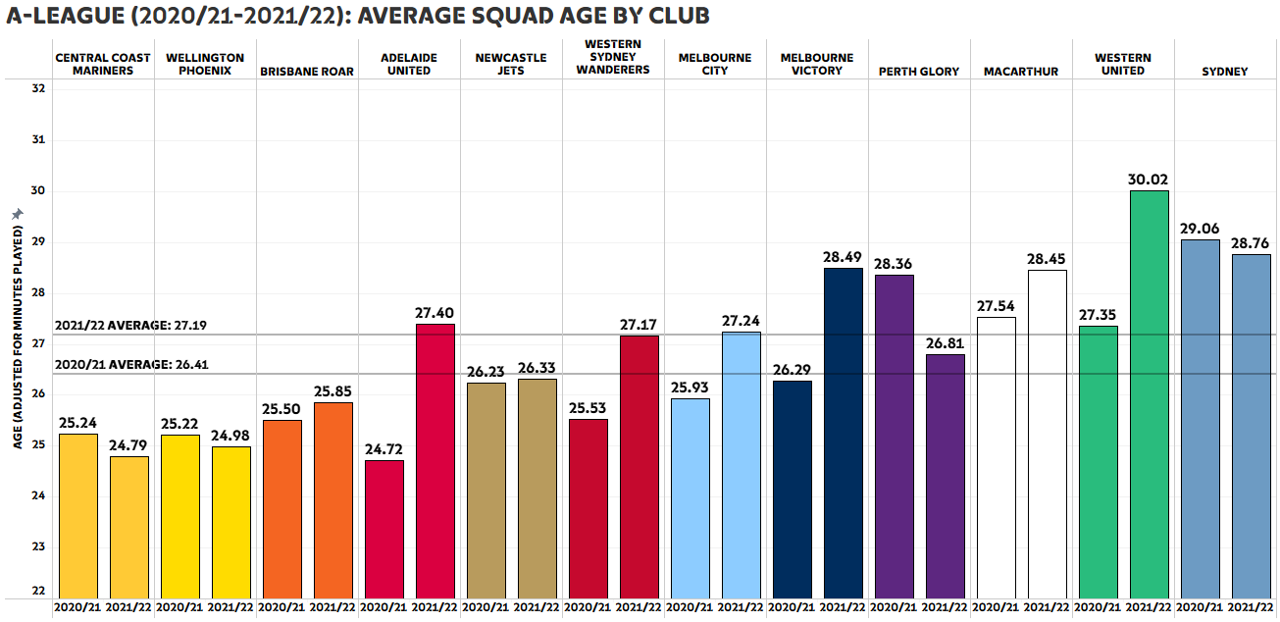
Over the two seasons, the A-League average increased by almost 1 year, with 8 of the 12 A-League clubs’ average ages increasing.
How many minutes is each player playing?
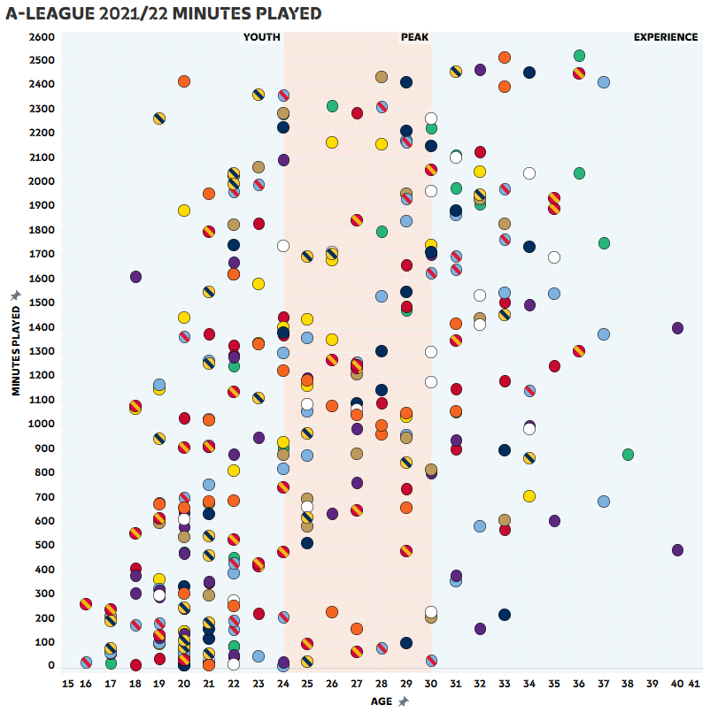
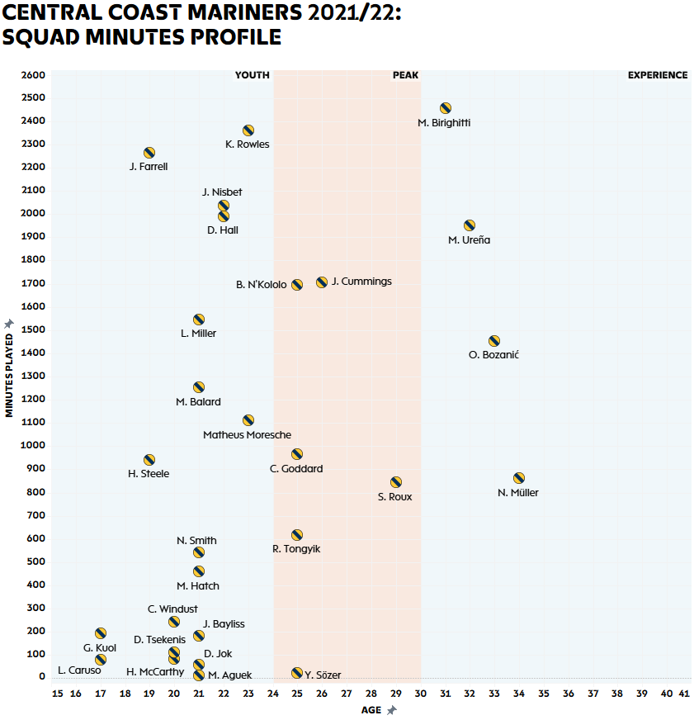
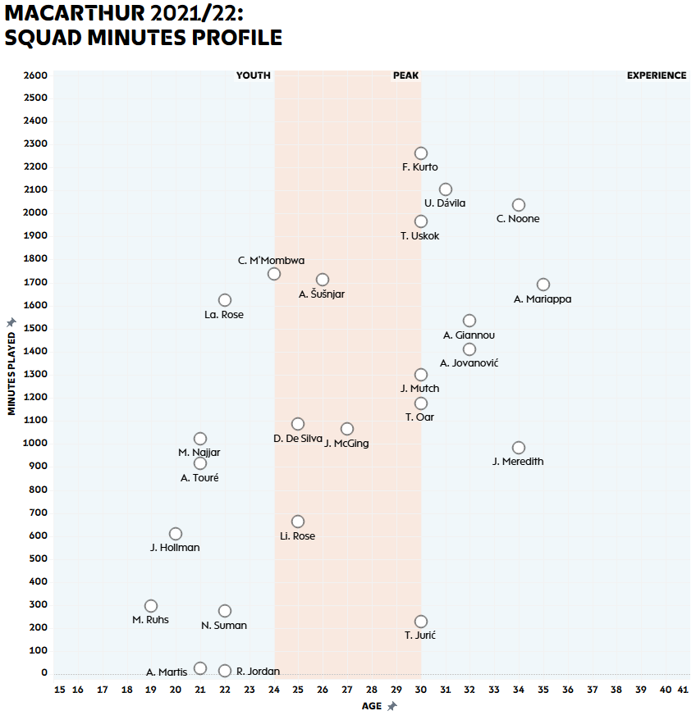
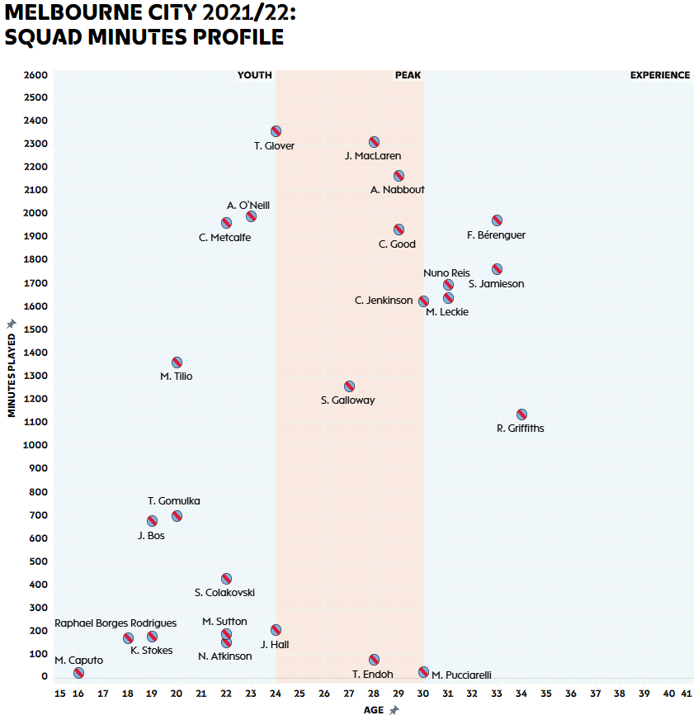
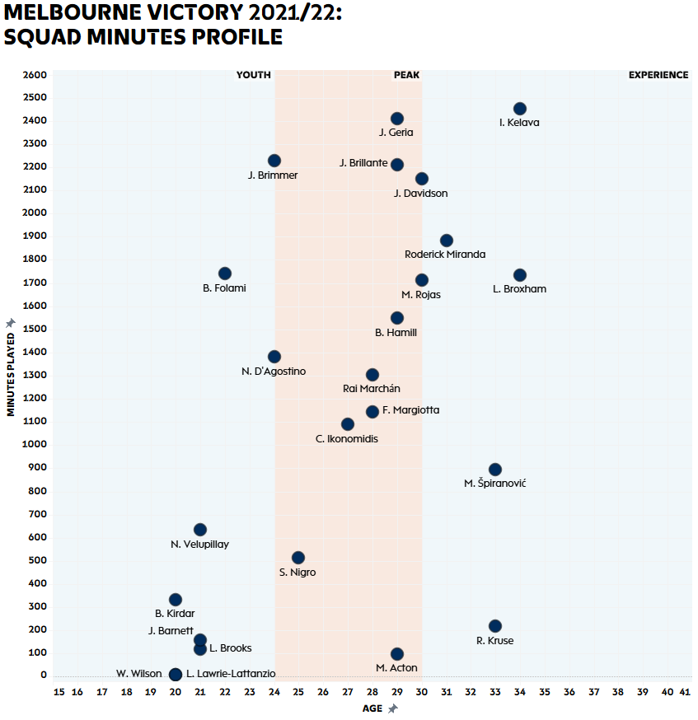
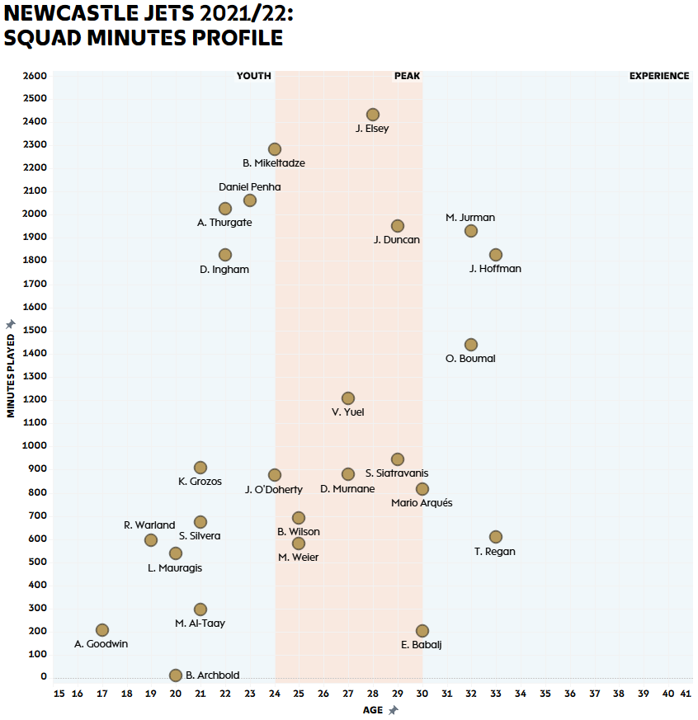
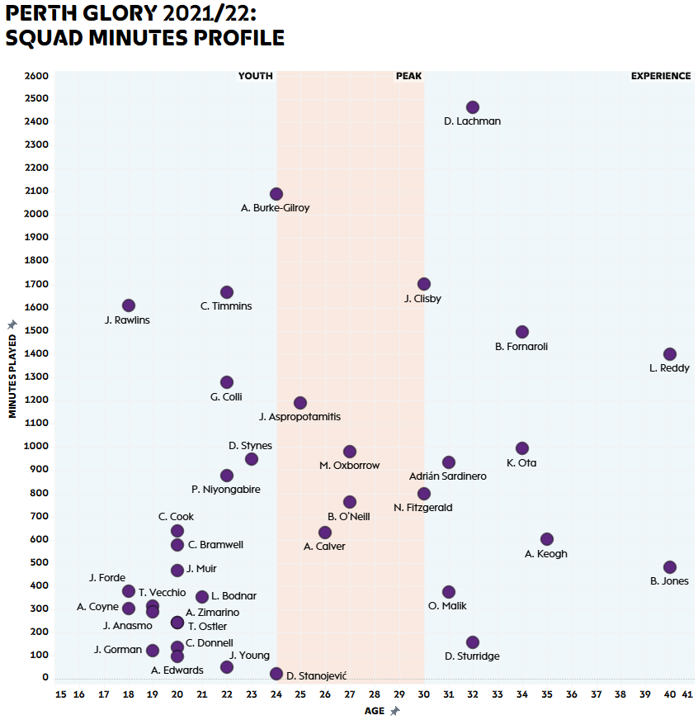
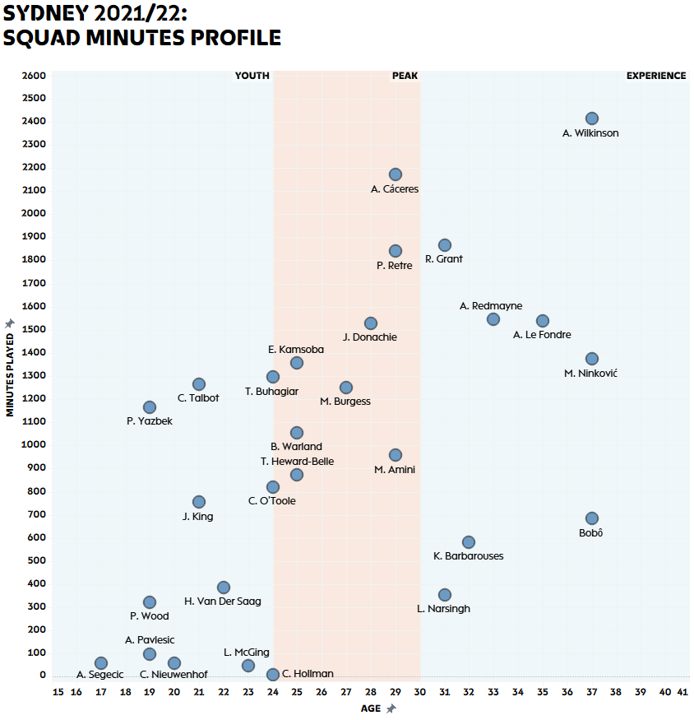
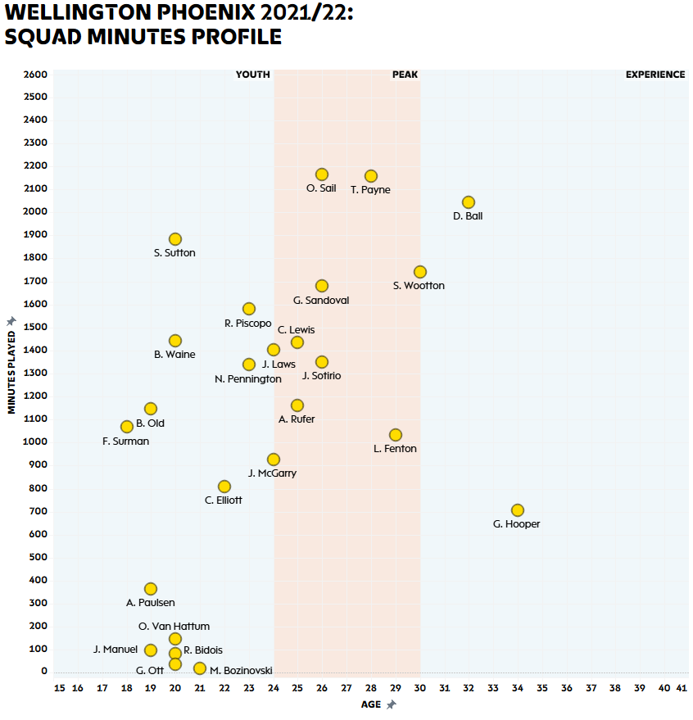
Zooming all the way in to the player level, we can look at individual player minutes/age. Here’s a colourful plot of all players who registered minutes in the 2021/22 A-League season:
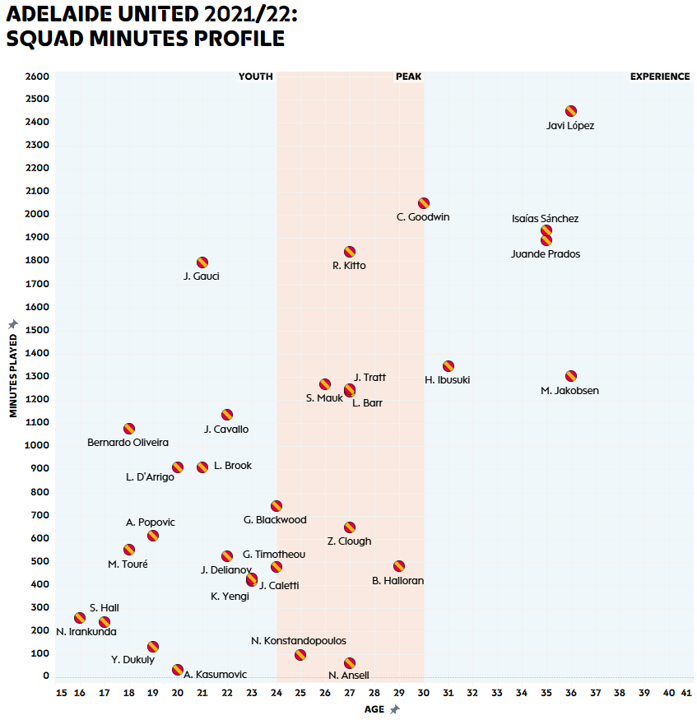
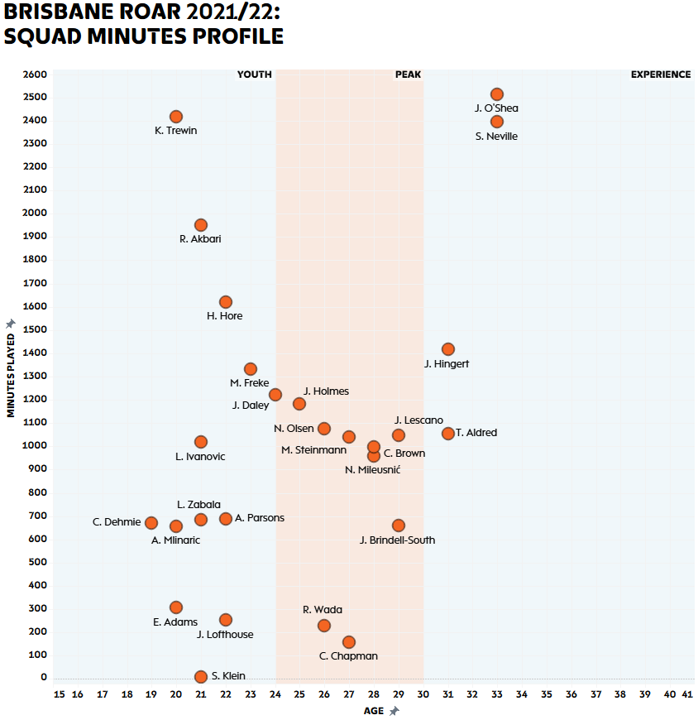
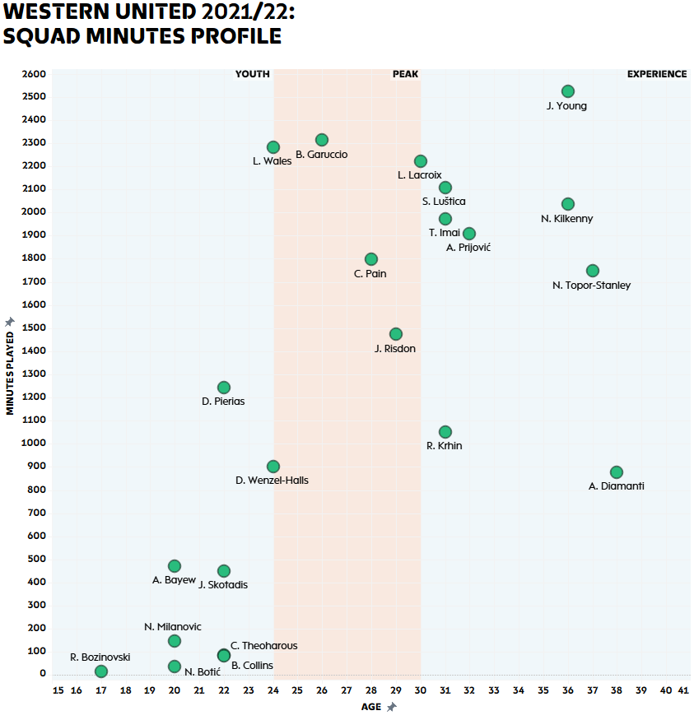
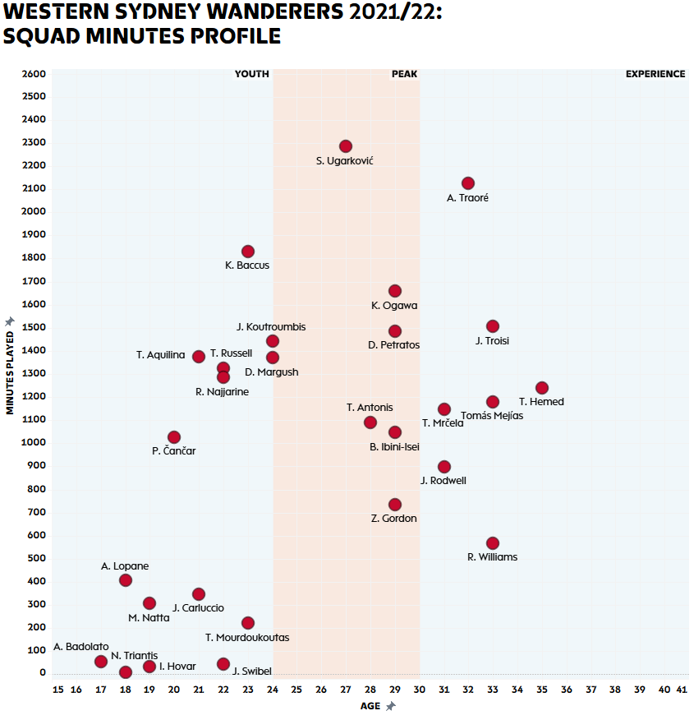
…and each club’s squad minutes profile by minutes/age (click to see a larger version):
What does it look like for Australia?
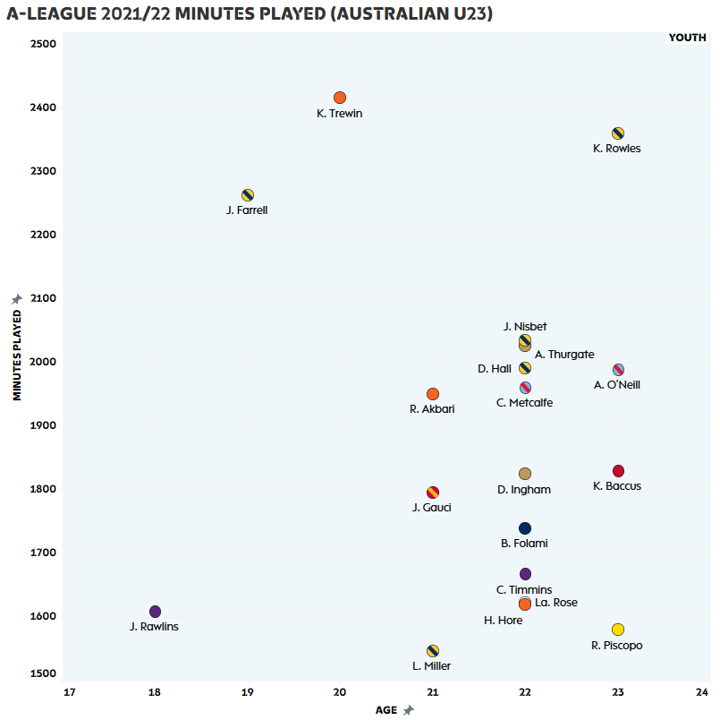
I also had a quick look at what playing minutes look like for players eligible to play for Australia under the age of 23 (note: some players may go on to represent other national teams - Rahmat Akbari has played for Afghanistan but may still be able to turn out for Australia).
Do you have any age-related questions still left unanswered? Let me know!
Note: Ages have been taken as at 13 May, data was extracted from Wyscout on 13 May, and all visualisations were put together with Tableau.