Newcastle Jets, Sydney FC & Central Coast Mariners: One Month of xG
What a start it’s been to the A-League!
The 2020/21 season is 1 month old, and with 27 games played, we’ve seen an astonishing 73 goals - an average return of 2.7 goals per game. With such high numbers and unexpected results, I decided to take a look at the underlying numbers with Newcastle Jets, Sydney FC, Central Coast Mariners and our good friend Expected Goals.
What even is xG?
Expected Goals (xG) is a much maligned and often misunderstood concept, partly due to its name (‘if we’re talking about expectations, he should score that every time’’), the decimal figure that it appears as (‘you can’t score 0.3 goals’) and the frequent lack of context provided along with football stats (‘0.3 xG...so what?’).
xG basically boils down to putting a numerical value between 0 and 1 on a chance/shot’s quality - the better the chance, the higher the value. xG models are built based on historical data, and take into consideration factors such as the location of the shot, what part of the body is used, whether it follows a cross, pass or dribble. Some more advanced models may take into account things like the height of the ball and the position of the defenders and goalkeeper.
Better chances have a higher expectation of being converted into goals. For instance, a penalty has an xG of around 0.76, while lower probability shots like Calem Nieuwenhof’s goal from outside the box against Wellington Phoenix, will have a lower value - an xG of 0.03.
Goals and Expected Goals generally end up correlating with each other, so xG can be pretty handy in understanding trends. It can also help with benchmarking both how well a team creates chances, the quality of the chances that they create, and also how effective they are at converting these chances into goals.
(Note: Different xG models will have different values that they produce. My analysis uses Wyscout’s model, Statsbomb’s model is probably the best in the market, but for a free alternative, check out Infogol.)
With that out of the way, let’s have a look at xG in the context of the A-League so far.
Newcastle Jets
The departures of Carl Robinson and Bernie Ibini to Western Sydney Wanderers headlined a chaotic off-season for Newcastle which left many wondering whether the Jets would be able to be competitive this season. From this context, it’s not surprising to see them sitting bottom of the ladder.
They’ve had some tough times already this season - Roy O’Donovan’s been some way off top form (though his combination play has been pretty good), there’s been some suspect decision-making in the final third (especially against Macarthur), and their first game against the Mariners saw Mark Birighitti play an absolute blinder in goal against them.
In defence, at times they’ve been somewhat unlucky. A mixup from a routine ball into the box against the Mariners saw them concede cheaply from a free kick, Riku Danzaki scored a heavily deflected shot from outside the box, Loic Puyo scored an overhead bicycle kick from a deflected cross, and even Ibini’s goal against his former club came from a rebound off the post.
At other times, they’ve looked very shaky from corners (from which they’ve conceded two goals) and their opponents have also hit the woodwork four times against them - the most in the league.
Watching their performances, you certainly feel that they’re playing better than four defeats and one win. They’ve been electric, with Craig Deans’ breakout stars Valentino Yuel and Ramy Najjarine ahead of the trusty Angus Thurgate - Steven Ugarkovic partnership in midfield all having decent performances.
Looking at their shot map, they are taking high quality shots from within central areas in the penalty box, and accordingly, they’ve got the highest xG per 90 minutes, are third in shots per 90 and top in xG per shot - a dangerous set of attacking stats.
In defence, while they’ve conceded a fair amount of shots, they’ve managed to keep their opponents to shooting from unfavourable positions - the Jets have conceded the 5th lowest xG per 90 and the 4th lowest xG per shot in the A-League.
On balance, they’ve scored about 1 goal per game less than their numbers suggest, while also conceding slightly more than expected (about 0.26 xGA). In theory, metrics balance out over longer periods of time, and if they can continue their solid attacking and defensive performances, we could be seeing the Jets climb the table over the course of the next few weeks.
Sydney FC
Performing better are Sydney, with two wins, a draw and a loss putting them at fourth on the ladder.
A common criticism has again come to the fore - *player* is not finishing chances. It’s an interesting one that crops up time and time again for Sydney, but why always Sydney?
First, a quick look at xG on its own. Sydney have generated 7.33 xG, scoring 6 times, while they’ve conceded 4 goals from 4.96 xG. They scored 3 goals against Macarthur but it should be noted that they were down to 10 men for the majority of the encounter, and the goals only started coming in later in the game, when you might expect Macarthur to be tired.
Another way to evaluate a team’s performances from xG is to look at the variation between goal difference and xG difference. Differences between goal and xG difference can show how a team is playing compared with their metrics. A team’s goal difference being higher than their xG difference suggests an over-performance against metrics, while goal difference being lower than xG difference suggests an under-performing team.
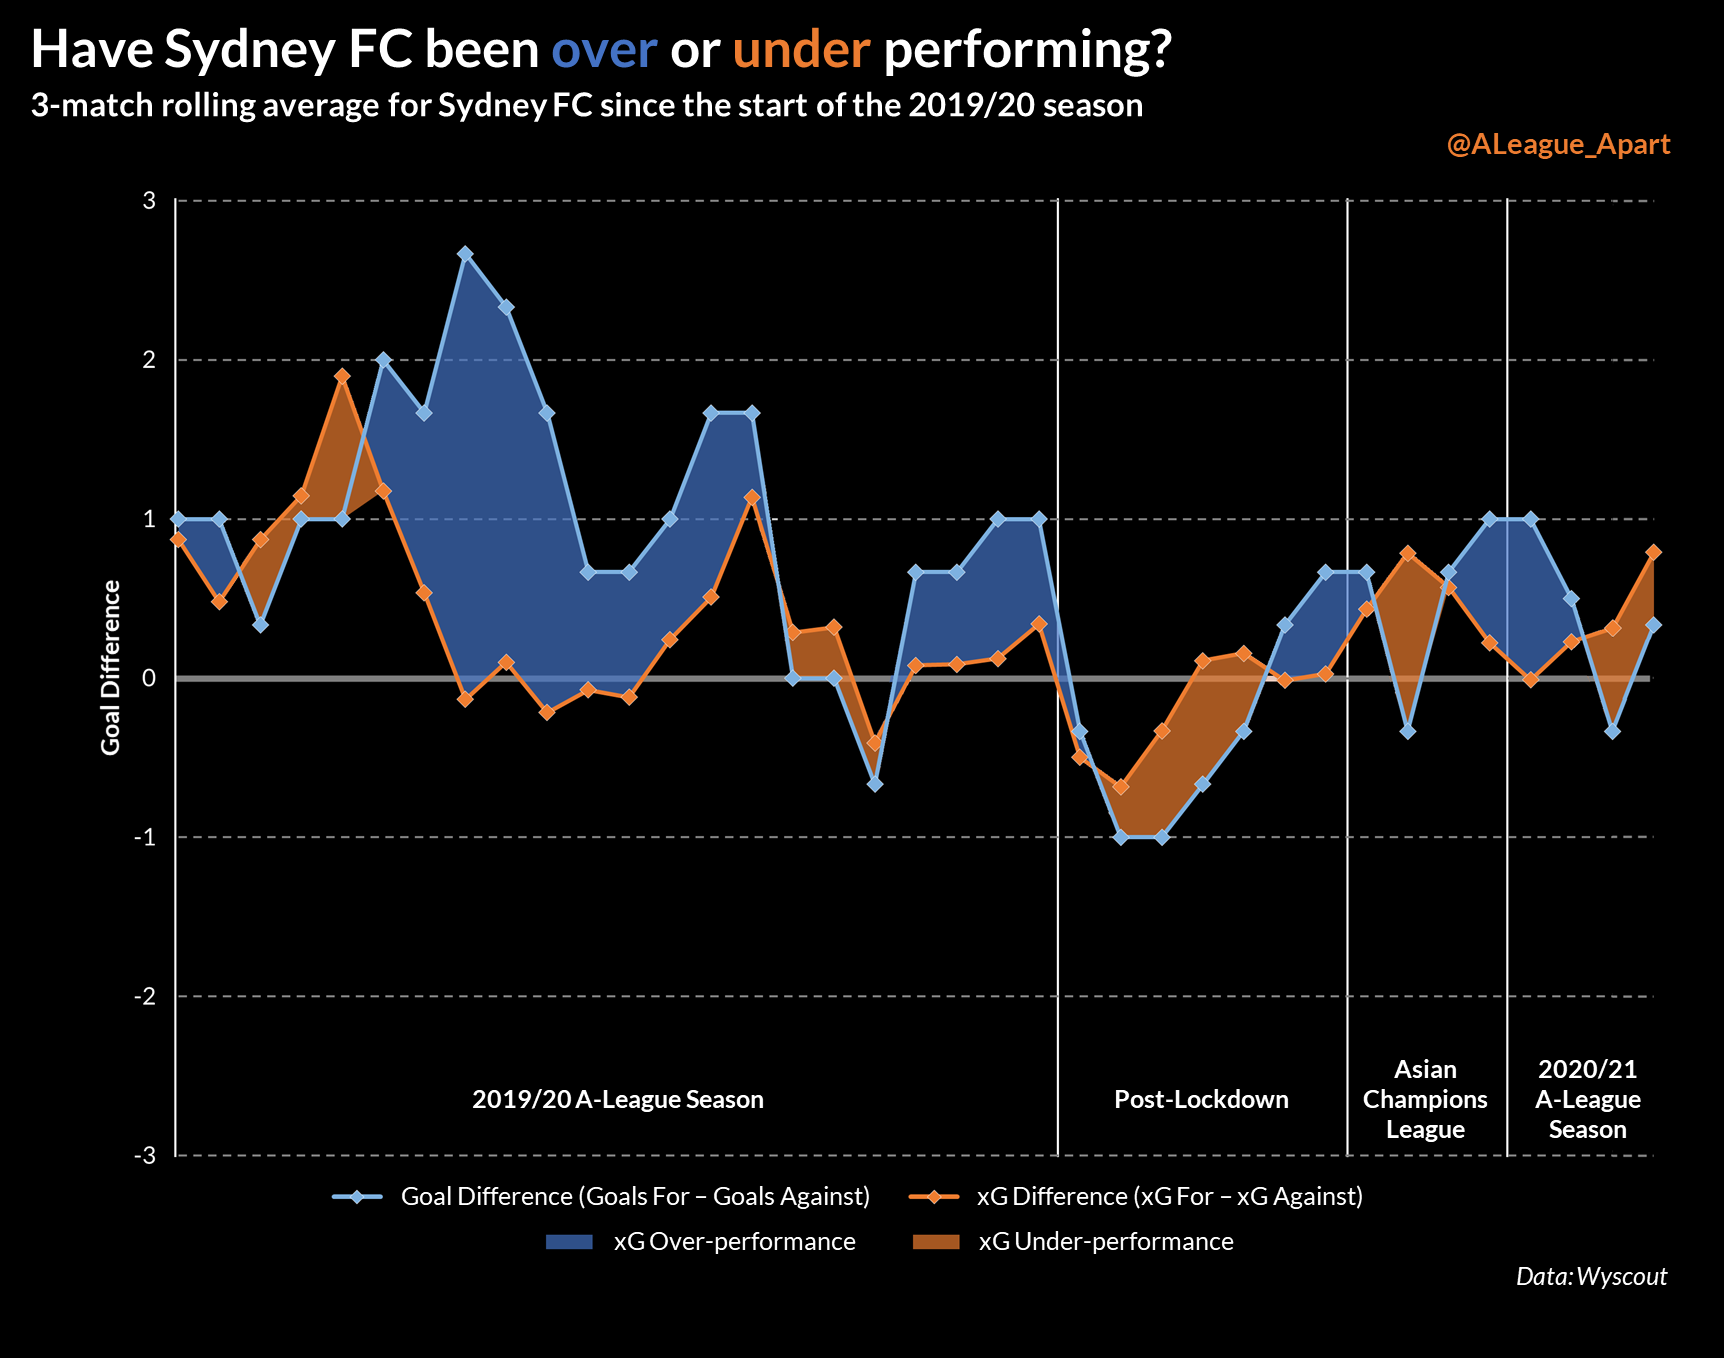
Being a winning team, Sydney’s performances have generally resulted in positive goal differences. Their xG differences, on the other hand, have not been as pronounced, suggesting that they don’t control games and dominate their oppositions. As a result Sydney do not create significantly more xG than their opponents.
Taking note of the large blue-shaded area from last season, we can see that while they didn’t dominate on xG difference, they performed significantly better than expected and accordingly won most of their games. Their more recent history, specifically since the more sluggish post-lockdown period saw them carry negative goal differences and under-performance (before improving again for the finals series), while this season starting from the Asian Champions League has been mixed so far.
Sydney’s performances have historically been defined by this over-performance on xG, spearheaded by efficient and effective finishers. Indeed, a look back at the last few years of Sydney’s main goalscorers shows that they’ve always had clinical goalscorers, finishing significantly more efficiently than their xG would suggest.
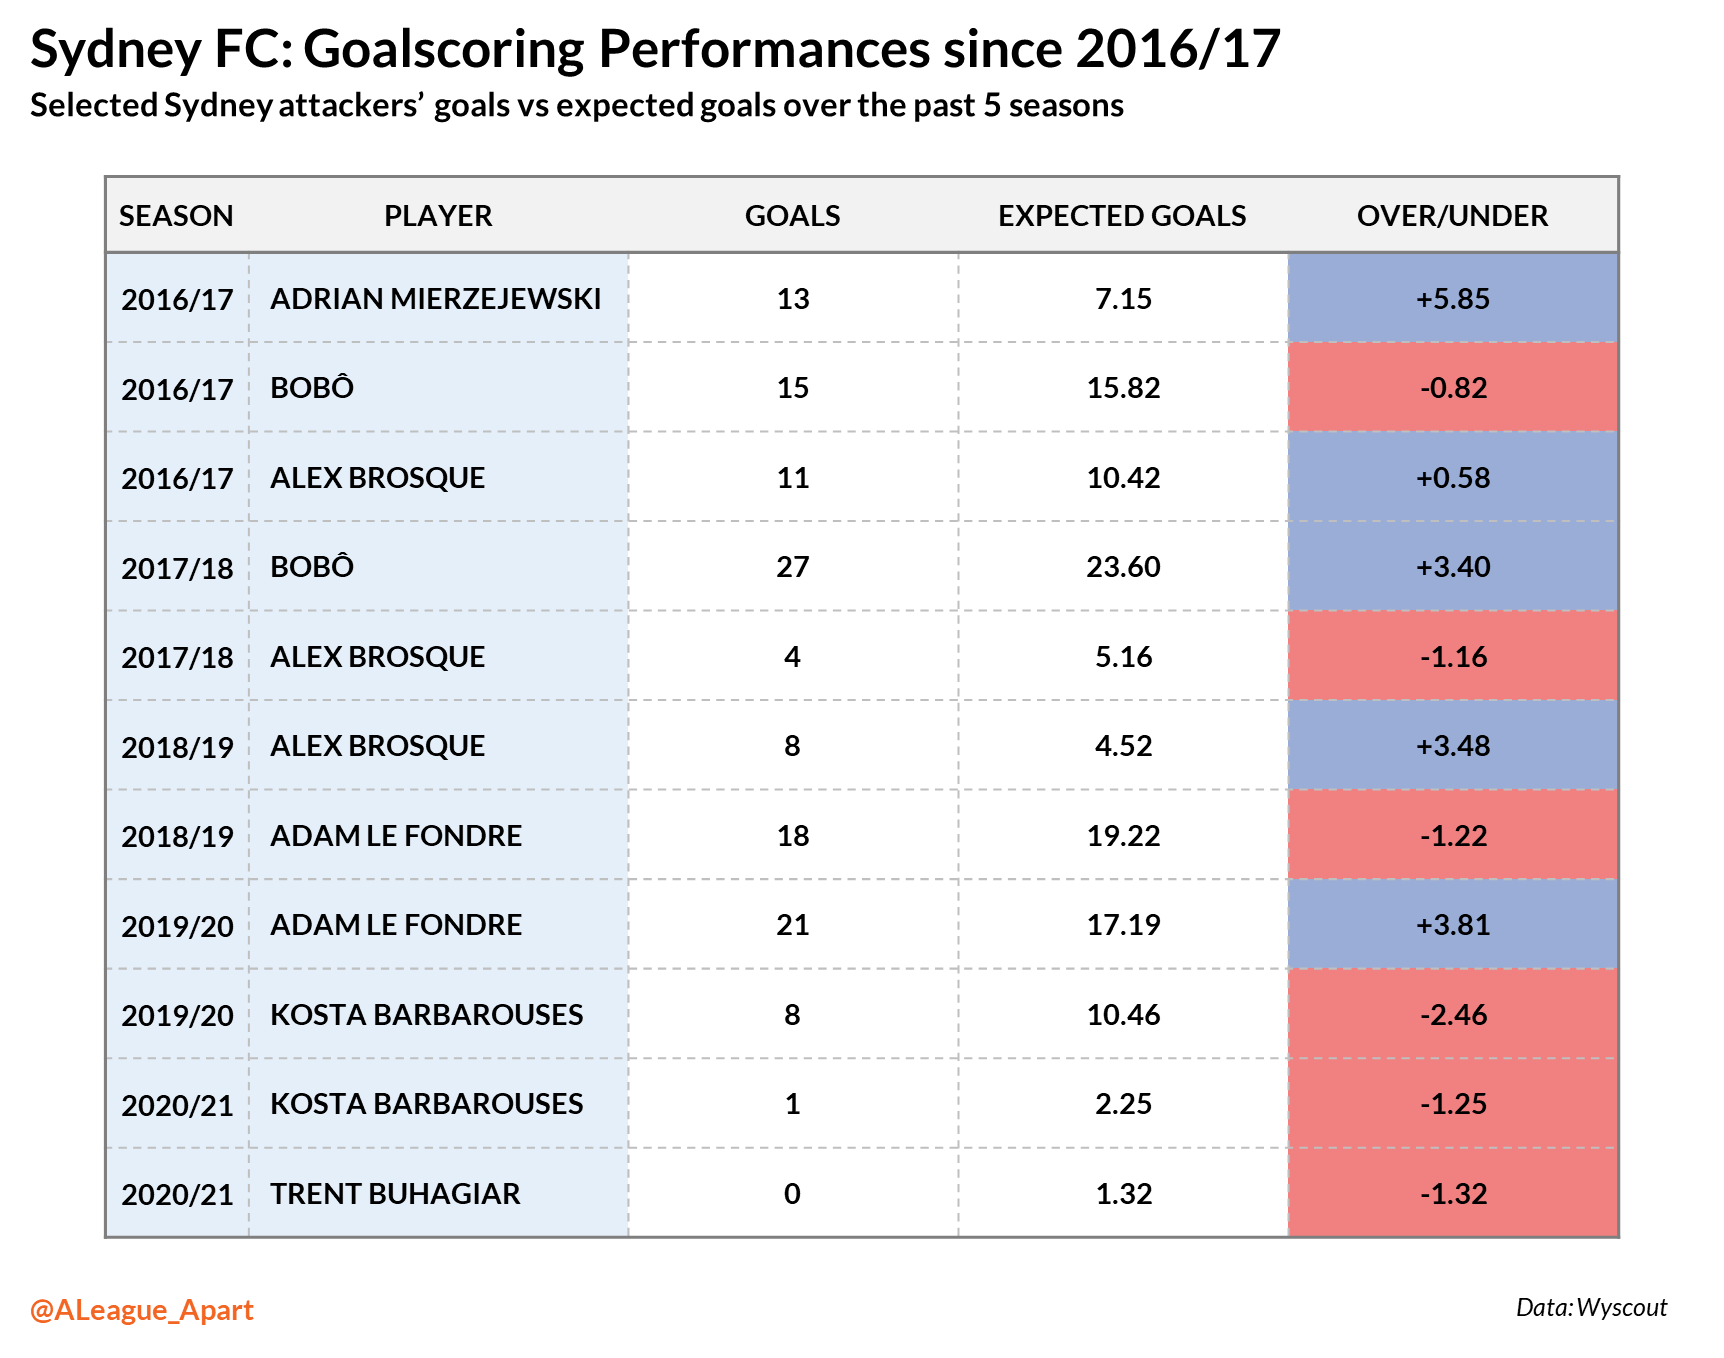
This season’s starting strikers Kosta Barbarouses and Trent Buhagiar are both one goal behind what the metrics suggest.
I think the reason the conversation around not making the most of chances has been so pronounced are two-fold: Sydney’s performances are heavily based on finishing efficiency (ie. if they're not finishing efficiently, they don't get results), and well...Sydney fans have been spoilt by the quality of their strikers in previous seasons.
Adam Le Fondre’s departure this season was probably unexpected and Covid has most definitely made it difficult to source another free-scoring replacement. Hopefully, Barbarouses, Buhagiar and Bobô can help the xG performance revert to Sydney’s high expectations.
Central Coast Mariners
Central Coast Mariners are having a fantastic start to the season. They’re second on the A-League ladder with 9 points and a goals record of 6 scored and only 3 conceded - almost unbelievable when taking last season into consideration, where they shipped an average of just over 2 goals per game.
They’ve played a defence-first game, where they’re happy to sit back, soak up pressure and break forwards quickly upon winning the ball. Their stats reflect this - averaging 42% possession, 349 passes per 90 (compared with an average of 529 for their opponents) and 11.39 shots per 90 (7th in the league).
One interesting stat is the quality and conversion of the chances their opponents have created. Their opponents have generated 5.7 xG, but from this, the Mariners have only conceded 3 goals - meaning they’ve defended well to an extent that they are 2.7 xG ahead of their metrics. They’re defending well and keeping opponents from shooting, but when they do concede shots, they are of fairly high quality, as can be seen in their shot map.
So how much of their defence performance is down to the defence, and how much is down to the goalkeeper?
To go deeper, we can have a look at Post-Shot Expected Goals (or Expected Conceded Goals).
Post-Shot xG is a similar metric to Expected Goals, in that it assigns a numerical value to the quality of a shot, but the key difference is that it’s assigned after the shot is taken. The quality of the shot depends on factors such as the distance to the goal, trajectory and power of the shot. A shot that is hit off-target has a post-shot xG of 0.00, while a shot heading right into the top corner from the six-yard box might have a post-shot xG of 0.80.
In essence, what this does is measure the shot from the goalkeeper’s perspective, giving the likelihood of a goalkeeper saving a shot on target. Additionally, this model can also quantify a goalkeeper’s shot stopping ability, by comparing how many goals they concede compared with the post-shot xG they face.
Here’s the end locations of shots that the Mariners have conceded so far this season.
Goalkeeper Mark Birighitti has faced shots totaling 4.16 post-shot xG, which suggests that he’s saved about 1 goal more than might be expected. As I mentioned in the section on Newcastle above, his game against the Jets contributed significantly, where he saved shots worth 2.06 goals. In this regard he’s second out of all A-League goalkeepers this season, saving an average of 0.22 goals per 90. (For context, Adam Federici is top at 0.43, and last season’s best was Tom Glover with 0.38. Birighitti scored -0.12 last season.).
Birighitti deserves a lot of credit for his goalkeeping performances, but as with metrics, they usually tend to revert back to the mean. The goals scored by Wellington are a good example of metrics reverting to the mean, with 2 goals conceded from 0.53 post-shot xG. For the Mariners’ sake, let’s hope he can maintain his form.
This article was originally published on The Reserve Team.
Note: All data is as at 1 Feb 2021